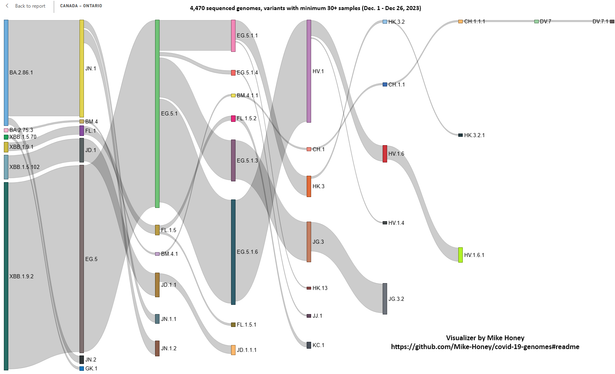
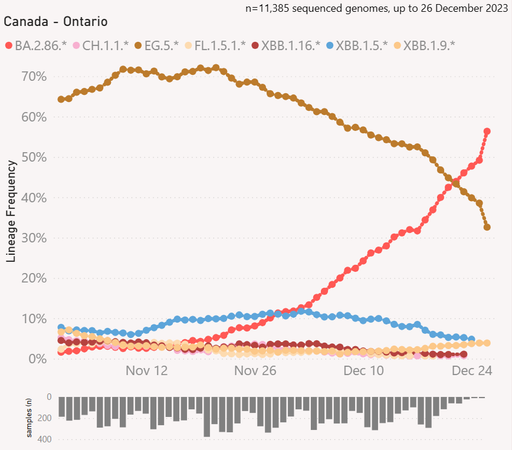
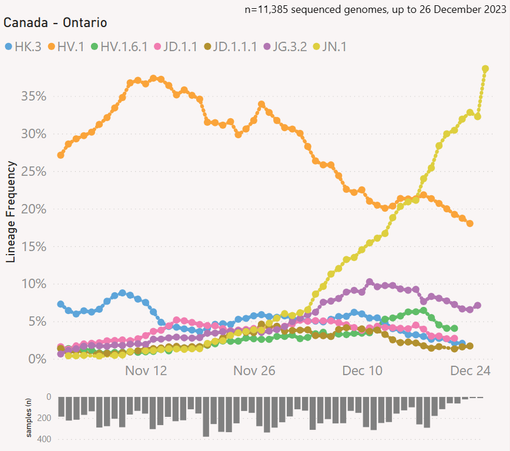
#Variant update for #Ontario, #Canada (up to Dec. 26, 2023)

The BA.2.86.* #Pirola clan of variants is now the majority of sequences at 56%. JN.1 "Pirola" has taken 1st place at 38% with HV.1 #Eris down to 18%. The next closest is JG.3.2 "Eris" at 7%. Graph tools by @mike_honey_ 🧵 1/

The one page easier to share version of this thread can be found at: https://threadreaderapp.com/thread/1743652837102354561.html

Thread by @jeffgilchrist on Thread Reader App

@jeffgilchrist: #Variant update for #Ontario, #Canada (to Dec. 26, 2023) The BA.2.86.* #Pirola clan of variants is now the majority of sequences at 56%. JN.1 Pirola has taken 1st place at 38% with HV.1 "Eris" down...…

You can find weekly Ontario stats including variants at ( http://covid.gilchrist.ca/Ontario.html ) and ( https://gilchrist.great-site.net/jeff/COVID-19/Ontario.html ). 2/

Public Health Ontario got rid of their COVID data tool and replaced it with a respiratory virus tool making some of the previously reported data no longer available.

They are now using the "viral season" calendar instead of year and only producing hospitalization rates by age group for entire viral seasons. I finally got around to making these stats (along with death rate). 3/

You can see that ever since the first Omicron BA.1 variant arrived in January 2022 that hospitalization rates for our youngest children (< 1) are higher or similar to older adults 60-79. 4/
This viral season to date children < 1 years old are being hospitalized for COVID at a rate of 50.8 per 100,000 population, almost the same as adults 60-79 are 52.8 per 100k population. Adults 80+ are being hospitalized 6x more than those aged 60-79 and children aged 1-4 are being hospitalized almost 10x more than teens 12-19. 5/
Now that PHO is updating their data again after the holidays, we can see that RSV positivity has gone down a lot (4.6%) while Flu A has increased significantly (15.4%) but COVID-19 remains in the lead (18.5%) ( https://www.publichealthontario.ca/en/Data-and-Analysis/Infectious-Disease/Respiratory-Virus-Tool ). 6/
Ontario Respiratory Virus Tool | Public Health Ontario

This tool provides comprehensive epidemiological information of respiratory virus activity in Ontario, including COVID-19, influenza and other respiratory viruses. Explore case trends, laboratory testing, and outbreaks, as well as COVID-19 outcomes and vaccination.

Public Health Ontario

There are a lot of people who are sick right now, and with multiple viruses circulating if you get a negative result on a rapid test (RAT) it might be tempting to think you only have a cold.

It is important to remember a recent study found that half of people's COVID-19 viral loads peaked on day 4 of symptoms so you may not test positive on a rapid test in the first few days ( https://www.cidrap.umn.edu/covid-19/evolving-peak-sars-cov-2-loads-relative-symptom-onset-may-influence-home-test-timing ). 7/

Evolving peak SARS-CoV-2 loads relative to symptom onset may influence home-test timing

Median SARS-CoV-2 viral loads, as measured by polymerase chain reaction cycle threshold and antigen concentrations, rose from symptom onset, peaking on the fourth or fifth day of symptoms.

@jeffgilchrist Just to confirm is this saying that approximately 1 in 5/6 of the Ontario population respectively (though probably with some overlap) have COVID-19 or flu-A? This isn't just a subset that were tested who were symptomatic? (the link is to wastewater analysis but I find it sufficiently extraordinary that I wanted to check).
@alastair sorry if you are talking about the "Respiratory virus activity" chart from PHO, it is not based on wastewater, but on the percent of virus testing that come back positive. So When it says COVID-19 18.5% it means that of all the PCR tests they did for COVID-19, 18.5% came back positive while the rest were negative, and for Influenza A at 15.4% that was people who were tested for Flu A, 15.4% of tests came back positive. Not percentage of population.