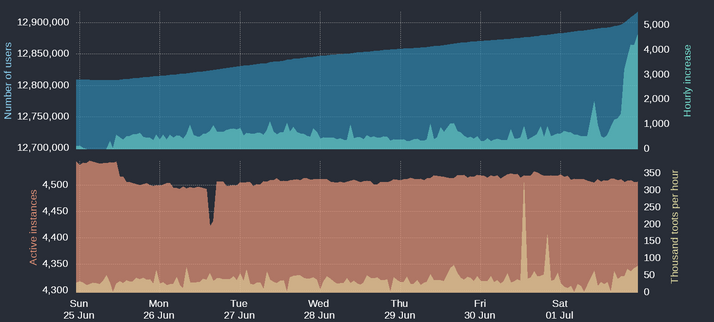
@Artemis13Athena There's a legend for each color, so there are 4 different data points in the picture: Number of users (darker blue), active instances (dark orange), toots (tweets) per hour (light orange). It seems to indicate that 4500 active users are producing on average 50 000 toots per hour. So everyone toots 11 times an hour. Hourly increase (light blue) indicates how many new users are joining per hour. So over 4000 per hour as of late.