This is the graph everyone needs to see for International Workers' Day.
alt text:
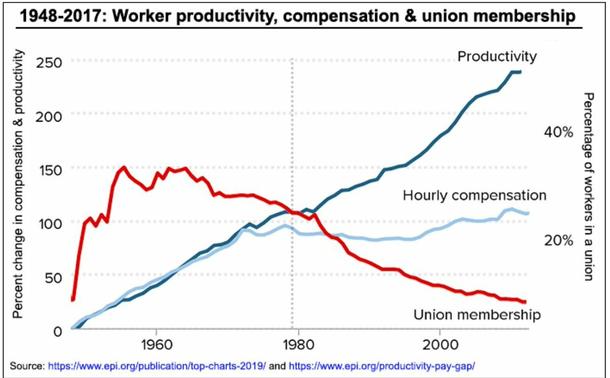
Graph titled 1948-2017: Worker productivity, compensation & union membership.
Union membership hit a high of around 30% around 1960 with a steady decline starting at 1970 down to around 5%.
Productivity linearly increasing the entire time ending at 250% increase.
Hourly compensation increased in lock step w/ productivity till the early 1970 and then mostly flattened off at around 100%.
Source: https://www.epi.org/publication/top-charts-2019/ and https://www.epi.org/productivity-pay-gap/

Black unemployment and underemployment is still too high, black college graduates have seen their wages fall, inaction from federal policymakers on the minimum wage has dropped the wage floor from under workers at the low end of the wage ladder, and workers are still thwarted in their efforts to bargain collectively for better wages from…