Where we use a method originally used for AGN to answer the question whether
we can use variability in individual X-ray lines to probe the variable stellar wind.
And the answer is: yes, we can!
The paper (submitted not yet refereed) is:
"Stellar wind variability in Cygnus X-1 from high-resolution excess
variance spectroscopy with Chandra" by Härer et al.
https://arxiv.org/abs/2304.14201
Let me disentangle what the title means: 1/6

Stellar wind variability in Cygnus X-1 from high-resolution excess variance spectroscopy with Chandra
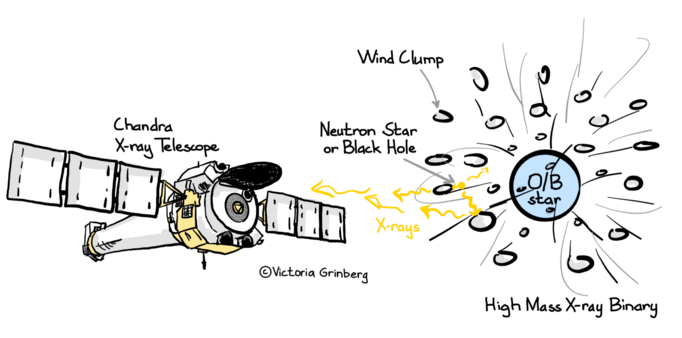
Stellar winds of massive stars are known to be driven by line absorption of UV photons, a mechanism which is prone to instabilities, causing the wind to be clumpy. The clumpy structure hampers wind mass-loss estimates, limiting our understanding of massive star evolution. The wind structure also impacts accretion in high-mass X-ray binary (HMXB) systems. We analyse the wavelength-dependent variability of X-ray absorption in the wind to study its structure. Such an approach is possible in HMXBs, where the compact object serves as an X-ray backlight. We probe different parts of the wind by analysing data taken at superior and inferior conjunction. We apply excess variance spectroscopy to study the wavelength-dependent soft X-ray variability of the HMXB Cygnus X-1 in the low/hard spectral state. Excess variance spectroscopy quantifies the variability of an object above the statistical noise as a function of wavelength, which allows us to study the variability of individual spectral lines. As one of the first studies, we apply this technique to high-resolution gratings spectra provided by Chandra, accounting for various systematic effects. The frequency dependence is investigated by changing the time binning. The strong orbital phase dependence we observe in the excess variance is consistent with column density variations predicted by a simple model for a clumpy wind. We identify spikes of increased variability with spectral features found by previous spectroscopic analyses of the same data set, most notably from silicon in over-dense clumps in the wind. In the silicon line region, the variability power is redistributed towards lower frequencies, hinting at increased line variability in large clumps. In prospect of the microcalorimetry missions that are scheduled to launch within the next decade, excess variance spectra present a promising approach to constrain the wind structure.