📣 March (& likely FINAL) update: COVID death rates by partisan lean & VACCINATION rates (w/bivalent booster data): https://acasignups.net/23/03/06/march-likely-final-update-covid-death-rates-partisan-lean-vaccination-rate-wbivalent1
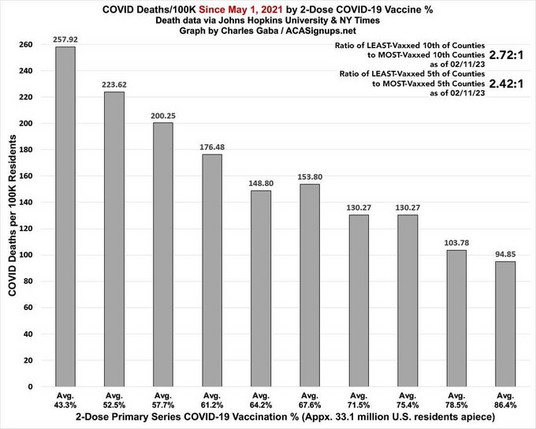
March (& likely FINAL) Update: COVID Death Rates by Partisan Lean & Vaccination Rate (w/Bivalent Booster data)

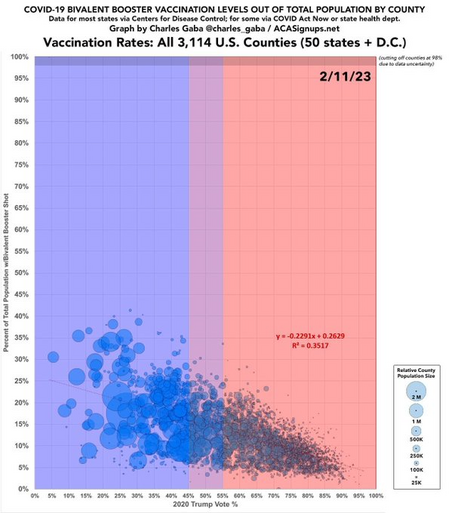
NOTE: With the news that the Johns Hopkins University COVID Tracking project & other reliable data sources are shutting down on March 10th, this may be the last update to this project, although I may be able to find alternatives for county-level COVID deaths. As of this writing, 69.3% of the total U.S. population has completed their primary COVID-19 vaccination series (including 94.3% of those 65+), but a mere 16.2% of the total population has also gotten their updated bivalent booster shot. Even among seniors it's only at 41.4% nationally. The bivalent booster has only been approved for all adults since the end of August 2022, but that's still pretty bad 6 months later: By comparison, a full 58% of the U.S. population had gotten their 2nd vaccination dose by the end of October 2021 (the exact same 6 months after the primary series was approved for all U.S. adults). Since we're so far removed from May 2021, and since the primary vaccination series effectiveness wears off after some time, I've also added both the partisan lean and vaccination rate breakout since August 31, 2022...the day that the FDA authorized the bivalent booster for all U.S. adults. As always, here's my methodology: County-level 2020 Population data via U.S.

ACA Signups

With Johns Hopkins, the NY Times *and* the White House COVID Response Team shutting down their county-level COVID death data tracking projects, this will likely be the last time I can compare county-level death rates vs vaccination rates.

Since COVID vaccines were widely available to all U.S. adults as of 5/01/21, the COVID death rate has run 2.7x higher in the least-vaccinated tenth of the U.S. than the most-vaccinated. It's run 2.4x higher in the least-vaxxed fifth vs. the most-vaxxed fifth.

Similarly, since 5/01/21, the COVID death rate has run 2.7x higher in the reddest tenth of the U.S. vs the bluest tenth, and 2.3x higher in the reddest fifth vs. the bluest fifth.

As I've noted before, the trend is far less dramatic if you only look at bivalent booster data (the past six months): The death rate is only around 25% higher in the portions of the U.S. w/the lowest bivalent dose rates vs. the highest bivalent rates since 9/01/22.

Overall, however, the COVID death rate is still ~60% higher in the reddest tenth vs. the bluest tenth since last fall, and 34% higher if you go by reddest/bluest fifths.

Here, once again, is what the PRIMARY and BIVALENT vaxx rates looks like across the political divide. As expected, the pattern is exactly the same for bivalent shots as the primary series, just not as extreme yet (and even the most-boosted counties are still only hovering at around ~40%, which is pretty sad):
@charlesgaba I just got covid, 3 years to the same time I got covid before. huge difference between the two. I was sick for 3 weeks, my throat was on fire. this time I was only sick for a few days. I am not sure if it is because I had virus before or I have had 5 shots (including the BA5) shot but this is like a typical bad cold. I got tested this time at the clinic, 3 years ago they didn't have tests so I can't 100% guarantee I had it but I live in northeast at time many got it here.
@charlesgaba Is there any way to remove confounding effects to focus on the benefits of vaccinations alone? I can easily imagine that those who are more conscientious about vaccinating are also more conscientious about masking, social distancing, etc., and I don't know how you'd tease the effects apart.
@marsroverdriver well, I can definitely tell you that the partisan divide started well before vaccines became available: https://acasignups.net/23/03/01/march-likely-final-monthly-update-county-level-redblue-covid-death-rate-divide-widens-again
March (& likely FINAL monthly) Update: County-Level Red/Blue COVID Death Rate Divide widens again

Last month I noted that the partisan COVID death rate gap, which had been shrunk down to almost nothing in December for the first time since COVID vaccines became widely available back in May 2021, had started to widen again: Well, the lines didn't flip after all in January--the reddest quintile jumped up faster than the bluest quintile after all--two months earlier than I expected: Bluest Quintile: 4.70 per 100K residents Reddest Quintile: 5.33 per 100K residents (13% higher) The January gap wasn't that significant by itself...except that it had looked like the rate in the reddest quintile might be lower last month. Sure enough, the COVID death rate gap between the reddest and bluest fifths of the country widened out more in February, with the rate in the reddest quintile running 63% higher than the bluest quintile (4.22/100K vs. 2.39/100K). The rate actually dropped from January to February in every quintile, but it dropped considerably more in the bluest fifth (to the lowest rate since April 2022) than the reddest. Again, the graph below looks at the reddest 20% and bluest 20% of the total U.S. population based on the 2020 Presidential election results at the county level.

ACA Signups