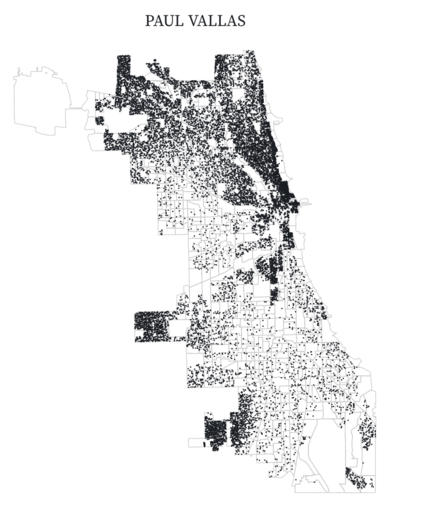
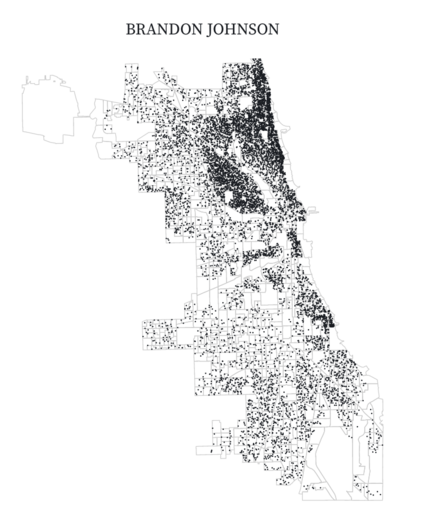
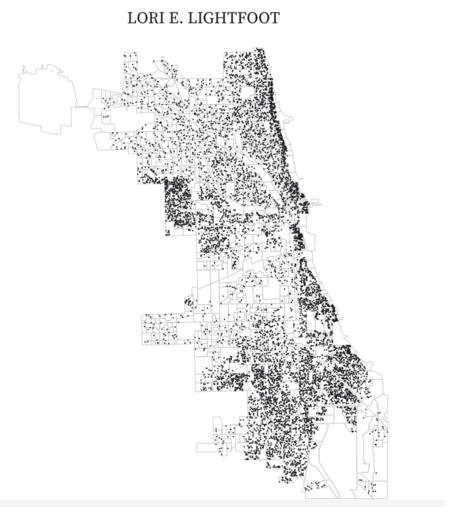
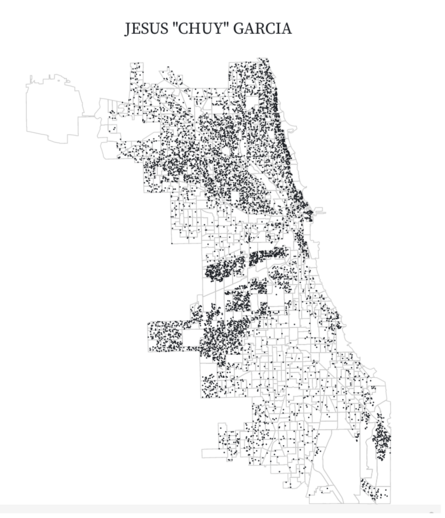
here are dot density maps for yesterday's #chicago mayoral race:
https://observablehq.com/@fgregg/2023-mayoral-election-dot-density-maps
here are dot density maps for yesterday's #chicago mayoral race:
https://observablehq.com/@fgregg/2023-mayoral-election-dot-density-maps
@chrisamico beautiful!
i actually implemented something convergent myself.
https://github.com/fgregg/chicago-dots/blob/main/src/points.py
it's heavily numpy-ified so it might be worth bringing some of those ideas over to your library?
@fgregg Very open to PRs, especially anything that makes it faster. I don’t use numpy much, so I’m sure I’m not getting the most out of it.
I also need to upgrade to the latest Shapely. That might do a lot.


