Hey hive mind,
What's the best set of color palettes for being color vision deficiency-friendly AND gray scale-friendly?
Viridis?? 👉 https://cran.r-project.org/web/packages/viridis/vignettes/intro-to-viridis.html Something else?
Hey hive mind,
What's the best set of color palettes for being color vision deficiency-friendly AND gray scale-friendly?
Viridis?? 👉 https://cran.r-project.org/web/packages/viridis/vignettes/intro-to-viridis.html Something else?
I tend to use colors derived from the color-blind palettes at https://colorbrewer2.org, and also the Okabe-Ito set. Since ~2019, the default color palette for base R, is based on Okabe-Ito (IIRC).
There are tools (e.g. web browser extensions), that simulate colorblindness, so it is easy to see the effect of a color selection.
I have a moderate degree of #Deuteranomaly (red-green), that is why this topic interests me. :-)
Thanks!
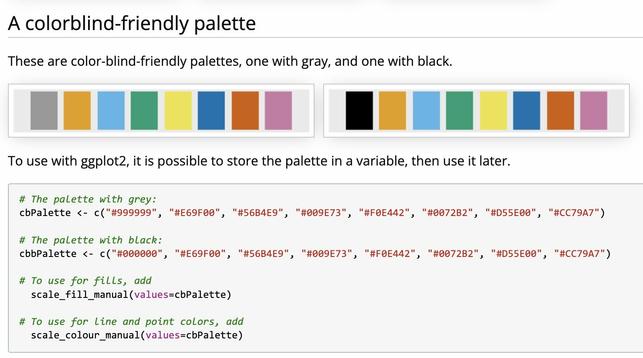
I often use this color vision deficiency-friendly palette in graphs but I just printed out a paper in B&W and OOF my choices don't work well in B&W.
So I'm pondering if I should amend my practices so my plots look better in B/W but still are CVD-friendly.