Check out how land is used in the United States. Cows take up the most space!

https://www.bloomberg.com/graphics/2018-us-land-use/
First in a 🧵 of #2022TopToots

Here’s How America Uses Its Land

The 48 contiguous states alone are a 1.9 billion-acre jigsaw puzzle of cities, farms, forests and pastures.

Bloomberg.com
Chocolate consumption and Nobel Prizes: A bizarre juxtaposition if there ever was one

Scientific American Blog Network

This map shows only people. It is a beautiful illustration of where people are concentrated.

If you squint, you can see Australia and New Zealand.

Map by Alasdair Rae https://www.visualcapitalist.com/cp/3d-map
Third in a 🧵 of #2022TopToots

3D Map: The World’s Largest Population Density Centers

What does population density look like on a global scale? These detailed 3D renders illustrate our biggest urban areas and highlight population trends.

Visual Capitalist

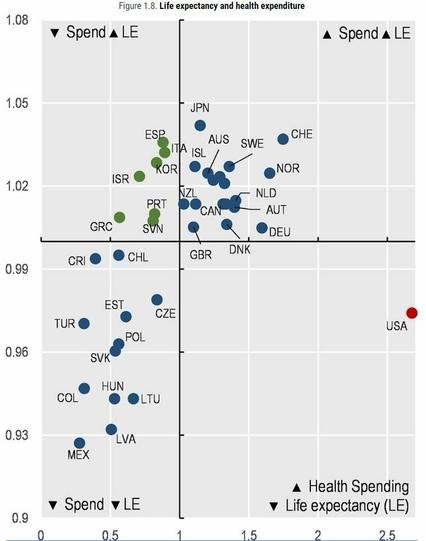
Check out this scatterplot of health spending per capita (x axis) & life expectancy (y axis) in OECD countries (lines = averages).

The United States sits alone in the bottom right quadrant due to its much higher spending and below-average life expectancy.

More info: https://oecd-ilibrary.org/sites/ae3016b9-en/1/3/1/index.html?itemId=/content/publication/ae3016b9-en&_csp_=ca413da5d44587bc56446341952c275e&itemIGO=oecd&itemContentType=book
Fourth in a 🧵of #2022TopToots

Home

OECD's dissemination platform for all published content - books, podcasts, serials and statistics

Estimated gender pay gap within job (same occupation at same firm)
🇯🇵 Japan 26%
🇰🇷 S Korea 19%
🇺🇸 US 14%
🇩🇪 Germany 13%
🇪🇸 Spain 12%
🇮🇱 Israel 12%
🇨🇦 Canada 12%
🇳🇴Norway 9%
🇫🇷 France 7%
From study https://nature.com/articles/s41562-022-01470-z#
by @OlivierGodechot & 28 others
Fifth in a 🧵 of #2022TopToots
Be sure to catch the end of this clever NASA "climate spiral" video showing monthly global temperature changes between 1880 and 2021
https://climate.nasa.gov/climate_resources/300/video-climate-spiral/
Sixth in a 🧵 of #2022TopToots
Video: Climate Spiral – Climate Change: Vital Signs of the Planet

The visualization shows monthly global temperature anomalies (changes from an average) between the years 1880 and 2021.

Climate Change: Vital Signs of the Planet
This amazing map shows travel time from London to the rest of the world in 1881
Seventh in a 🧵 of #2022TopToots
2022 Press Freedom Rank
1 Norway
2 Denmark
3 Sweden
16 Germany
19 Canada
24 UK
38 Taiwan
41 Burkina Faso
42 US
71 Japan
86 Israel
110 Brazil
119 Qatar
149 Turkey
150 India
155 Russia
168 Egypt
175 China
178 Iran
180 N Korea
https://rsf.org/en/index
Eighth in a 🧵 of #2022TopToots
@conradhackett you are missing the most interesting examples like Costa Rica / an island of press freedom… maybe we should consider why? good examples are more useful bad ones ;)