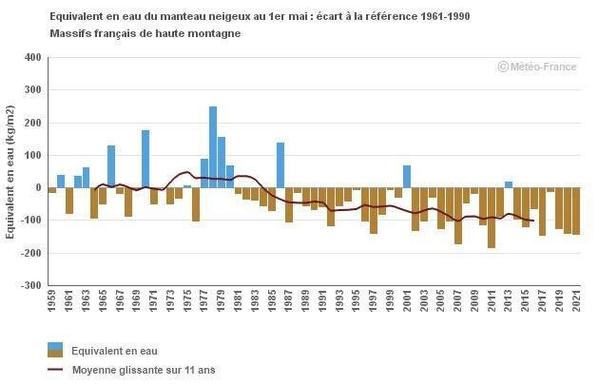
En ce #InternationalMountainDay 2022, puisque le sujet semble intéresser ces jours-ci, quelques infos sur l’évolution passée & future de la #neige en #montagne.
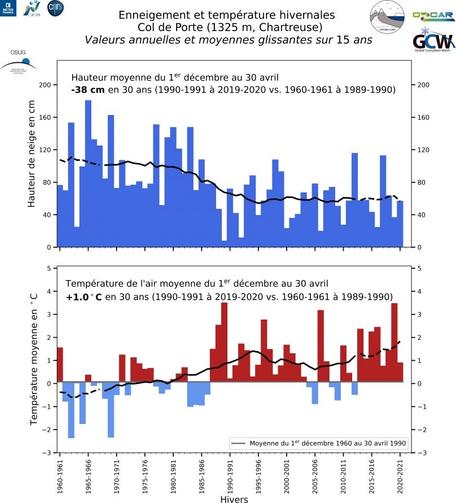
Commençons par l’évolution à l’observatoire nivo-météo du #ColDePorte (Chartreuse)
https://www.ecologie.gouv.fr/impacts-du-changement-climatique-montagne-et-glaciers
🧵 [1/14]
Impacts du changement climatique : Montagne et Glaciers
Afin de décrire l'état du Climat et ses impacts sur l'ensemble du territoire français, l’ONERC (Observatoire national sur les effets du réchauffement climatique) s’est doté d’indicateurs. Un indicateur est une information, associée à un phénomène, permettant d’en indiquer l’évolution dans le temps, de façon objective, et pouvant rendre compte des raisons de cette évolution. Dans cette fiche, les indicateurs s'intéressent à la montagne et aux glaciers.