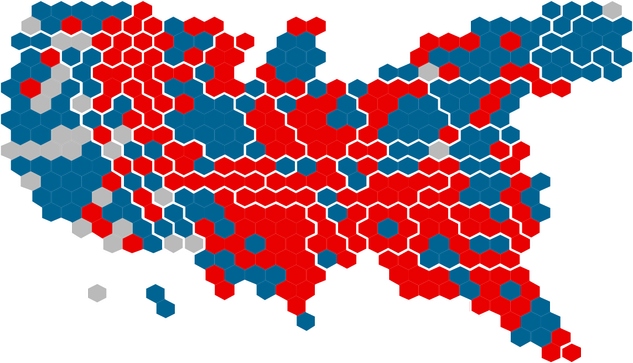
These two maps are a good example how data visualization influences our perception. Same election, same results, but one shows the winning party by area, one by population density. (Map Credits: Karim Douïeb, Jetpack.ai)

Edit: This is not based on the midterms this week. I wanted to point out the difference in visualization. It was originally done in 2019

@mistakenotmy I've always thought the left map is misleading, it's lazy of media sites to use it (or biased, if it's a deliberate choice to skew perceptions).
@cazdoespolitics I don't think it's deliberate in most cases (though it has been used by a not-to-be-named former president to strengthen his "point").
@mistakenotmy Maps are inherently political, choices in representing information involve making decisions about what to prioritise. In this case, whether to represent the US in ways that the population recognise, but compromise on the size of political party influence, or to emphasise political size over recognisability. The reasoning for that choice is absolutely linked to intent. The former creates the perception of republican power, the latter democrat power.
@mistakenotmy This is another way of representing the same information, this time by seats, an effort to make a choice that represents reality without bias towards one or the other. The choices that are made in what maps are used carry implicit messages about those making the choice.
@cazdoespolitics @mistakenotmy The first map implies overwhelming red power, while the second shows a much closer balance that you have to parse carefully to understand its nuance. That close balance, sometimes red winning, sometimes blue, is the reality we live in, so I think it is the better choice. But it’s also harder to absorb at a glance, which may be why it’s not used by broadcasters.