4 models, 5+ years, 8 institutes, 20 coauthors under the brilliant leadership of @drgilbz.bsky.social @hofsteengemarte.bsky.social + @dmidk Abraham Torres Alavez: The
evaluation of the #polarRES Antarctic climate model ensemble is finally published Great working with you all team!
And now for the Arctic...
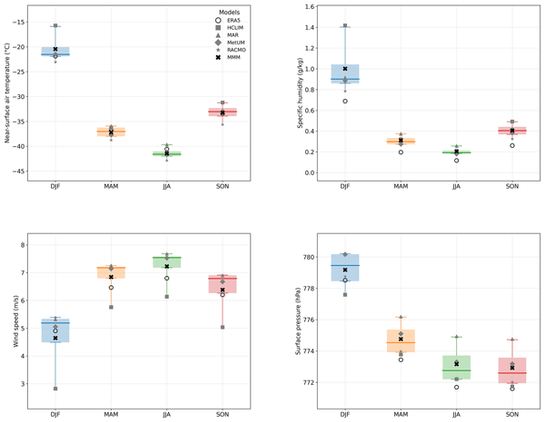
The PolarRES dataset: a state-of-the-art regional climate model ensemble for understanding Antarctic climate
Abstract. Antarctica's weather and climate have global impacts, influencing weather patterns, ocean currents and sea levels worldwide. However, Antarctica is vast and complex, and the atmospheric processes that govern its climate are strongly influenced by its steep terrain, particularly around the coastal periphery. Our scientific understanding of this complex environment is hampered by the lack of reliable observations and gridded datasets at sufficiently high spatial and temporal resolution. High-resolution regional climate models, RCMs, can provide a solution to the sparsity of observational data and low resolution of reanalyses, facilitating more in-depth assessments of crucial climate variables like precipitation, wind and temperature that are strongly influenced by topography. Here we present and evaluate a comprehensive, high-quality, ∼ 11 km resolution RCM dataset, the PolarRES ensemble, for the period 2000–2019. We show that the ensemble largely out-performs ERA5, especially with regard to variables like coastal winds and precipitation. There are no consistent seasonal differences in biases, but there are persistent regional biases. Victoria Land and the Trans-Antarctic Mountains are the regions the RCMs and ERA5 struggle the most with, which suggests that further investigation and model development is needed in this area. Each RCM has strengths and limitations, but overall the ensemble captures the observed weather and climate of Antarctica well. The PolarRES ensemble offers a novel and exciting way of evaluating climate processes and features, and we encourage researchers to use the data, which are freely available, to explore pertinent climate questions of local, regional and global significance.