

🎨 How to create elegant #dataviz with base #rstats and the #tinyplot pkg
📈 useR! 2025 presentation by Grant McDermott @gmcd presents

🎨 How to create elegant #dataviz with base #rstats and the #tinyplot pkg
📈 useR! 2025 presentation by Grant McDermott @gmcd presents
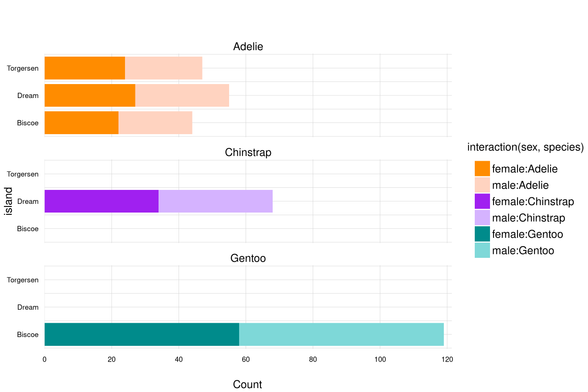
🚨 The #tinyplot pkg for #rstats #dataviz now also has support for barplots (in the R-universe version).
Grouping and faceting can be done using tinyplot's formula-based syntax.
Example: Frequencies of penguin species by island, stacked by sex. (Code in alt text).
@lwpembleton I just came across your post. I took it as inspiration to achieve sth similar with base #Rstats and #tinyplot
There is one small issue that I could not solve instantly with the Cylinder as a factor. Therefore, this `Cylinders <- as.factor(mtcars$cyl)` hack. Maybe @gmcd or @zeileis has a quick suggestion?

#rdatatable is a pleasure to work with. Sometimes mind bending (why does it not work? 🤔 … ahh, lists 🤦♂️)
but most of the time great.
I use it in combination with #tinyplot. I had situations where my code got faster and shorter by doing this.
Enjoy
# objetivo: Actualizar script en el tinyverso
# contexto: Gráfico millas en función del peso por cilindro
# entrada : mtcars
# plot : Con leyenda sin esfuerzo
# - leyenda continua ?
#tinyplot #rstats #Lecheria #ANZ #anzoátegui #CostaRica #tinyverso #baseR #Palette
Christmal special for the R base plot folks:
take a look at the latest #tinyplot developments.
@gmcd et al. have a nice tool for you.
install.packages("tinyplot", repos = "https://grantmcdermott.r-universe.dev")
