Death of the German Auto Industry? Brussels’ Green Policy Could Cost 225,000 Jobs

Death of the German Auto Industry? Brussels’ Green Policy Could Cost 225,000 Jobs
Labour costs across Europe: Where are they highest and lowest?
Have you ever wondered how much the cost of employing someone varies across different parts of Europe? The answer is very wide.
The maximum-to-minimum ratio is more than five times, showing the level of disparities.
Euronews takes a closer look at the significant differences in labour costs across the EU and the factors driving them.
#Europe #LabourCosts #Labour #LaborCosts #Labor #Economy #Business
Annual increase in euro area hourly #LabourCosts at 4.6% in Q3 2024 (EU +5.1%) https://ec.europa.eu/eurostat/en/web/products-euro-indicators/w/3-16122024-AP
Annual increase in euro area hourly #LabourCosts at 4.6% in Q3 2024 (EU +5.1%) ec.europa.eu/eurostat/en/web…
---
https://nitter.privacydev.net/EU_Eurostat/status/1868596939647803663#m

Overview In the third quarter of 2024 the hourly labour costs rose by 4.6% in the euro area and by 5.1% in the EU, compared with the same quarter of the previous year. These figures are published by Eurostat, the statistical office of the European Union. The two main components of labour costs are wages & salaries and non-wage costs. In the euro area, in the third quarter of 2024 compared with the same quarter of the previous year the costs of hourly wages & salaries increased by 4.4%, while the non-wage component increased by 5.2%. In the EU, in the third quarter of 2024 compared with the same quarter of the previous year the costs of hourly wages & salaries increased by 5.0% and the non-wage component increased by 5.3%. Breakdown by economic activity In the third quarter of 2024 compared with the same quarter of the previous year, hourly labour costs in the euro area rose by 4.6% both in the (mainly) non-business economy and in the business economy: +4.6% in industry, +5.0% in construction and +4.5% in services. In the EU, hourly labour costs grew by 5.1% in the (mainly) non-business economy and by 5.0% in the business economy: +5.3% in industry, +5.5 % in construction and +4.9% in services. In the EU, in the third quarter of 2024 compared with the same quarter of the previous year, the economic activity (NACE Rev. 2 sections) that recorded the highest increases in hourly wage costs were: R – ‘Arts, entertainment and recreation’ (+7.0%) P – ‘Education’ (+6.2%) The lowest annual increase was recorded in NACE Rev. 2 section B – ‘Mining and quarrying’ (+2.6%). In the EU, in the third quarter of 2024 compared with the same quarter of the previous year, the economic activity (NACE Rev. 2 sections) that recorded the highest increases in the non-wage component were: I – ‘Accommodation and food service activities’ (+6.6%) F – ‘Construction’ (+6.3%). The lowest annual increase was recorded in NACE Rev. 2 section B – ‘Mining and quarrying’ (+3.2%). Hourly wage costs across countries In the third quarter of 2024 compared with the same quarter of the previous year, the highest increases in hourly wage costs for the whole economy were recorded in Romania (+17.1%), Croatia (+15.1%), Hungary (+14.1%), Bulgaria (+12.7%) and Latvia (+12.6%). Three more EU Member States recorded an increase of 10% or more, namely: Poland (+12.0%), Lithuania (+11.0%) and Austria (+10.0%), while Greece recorded a decrease (-2.9%). Tables Nominal hourly labour costs of whole economy (NACE Rev. 2 sections B to S) % change compared with same quarter of previous year - calendar adjusted Q3 2023 Q2 2024 Q3 2024 TOTAL WAGES OTHER TOTAL WAGES OTHER TOTAL WAGES OTHER Euro area 5.0 5.1 4.7 5.2 4.9 5.8 4.6 4.4 5.2 EU 5.4 5.6 5.0 5.6 5.5 5.9 5.1 5.0 5.3 Belgium 7.9 7.9 7.9 2.6 2.5 2.6 2.6 2.6 2.7 Bulgaria 14.9 15.6 11.4 15.4 15.4 15.1 12.8 12.7 13.4 Czechia 8.1 8.1 8.1 6.4 6.4 6.3 5.3 5.4 5.0 Denmark 2.9 2.9 2.7 5.0 5.0 4.7 4.2 4.2 4.6 Germany 4.8 5.3 3.5 6.0 5.7 7.2 4.2 4.0 4.8 Estonia 11.0 11.0 11.0 4.3 4.2 4.3 8.6 8.7 8.5 Ireland 10.9 6.3 44.7 6.6 6.1 10.0 5.4 5.0 7.4 Greece 6.7 7.0 5.6 9.3 8.7 11.5 -2.6 -2.9 -1.7 Spain 5.5 4.6 7.8 4.0 3.9 4.3 5.0 4.7 5.7 France 3.7 3.8 3.6 3.7 3.3 4.8 3.0 2.7 3.8 Croatia 16.2 16.2 16.5 17.6 17.6 17.9 15.1 15.1 15.1 Italy 2.4 2.6 2.1 4.2 4.2 4.3 5.4 5.2 6.0 Cyprus 5.7 5.9 4.9 4.1 4.6 1.6 4.0 4.7 1.5 Latvia 12.0 12.4 10.4 11.1 11.0 11.3 13.1 12.6 15.2 Lithuania 11.2 11.4 7.8 11.0 10.9 12.1 11.2 11.0 16.3 Luxembourg 7.8 7.8 7.6 3.7 3.7 4.4 1.0 1.0 0.9 Hungary 15.1 15.4 13.3 12.7 13.0 10.8 13.9 14.1 12.8 Malta 4.5 4.6 3.8 2.4 2.3 3.1 4.6 4.7 3.7 Netherlands 5.8 6.3 4.4 5.6 5.3 6.5 6.0 5.7 7.1 Austria 6.1 5.9 6.9 8.2 8.1 8.5 10.3 10.0 11.3 Poland 12.2 12.2 12.1 12.9 13.0 12.6 12.0 12.0 11.8 Portugal 5.1 4.8 6.4 7.4 7.4 7.4 8.4 8.4 8.2 Romania 14.9 15.1 9.3 15.0 15.0 14.4 17.1 17.1 16.7 Slovenia 4.8 4.9 4.2 6.1 6.2 5.7 4.5 4.5 4.4 Slovakia 7.4 8.1 5.1 9.1 7.8 13.1 7.5 6.3 11.2 Finland 4.0 3.8 4.8 1.4 2.1 -2.3 2.0 2.7 -1.7 Sweden 4.4 4.2 4.9 3.4 3.7 2.6 3.1 3.4 2.6 Norway 7.7 6.0 18.1 5.8 5.5 5.6 6.1 6.3 5.7 Iceland 8.9 8.8 8.9 1.3 1.2 1.4 5.6 5.5 5.6 Labour cost data are subject to revision, in particular for the latest quarters, when new source data become available. TOTAL = total labour costs WAGES = wage and salary costs OTHER = non-wage costs Source dataset: lc_lci_r2_q Nominal hourly labour costs of business economy (NACE Rev. 2 sections B to N) % change compared with same quarter of previous year - calendar adjusted Q3 2023 Q2 2024 Q3 2024 TOTAL WAGES OTHER TOTAL WAGES OTHER TOTAL WAGES OTHER Euro area 5.4 5.4 5.4 5.0 4.8 5.6 4.6 4.3 5.4 EU 5.8 5.9 5.5 5.4 5.2 5.7 5.0 4.9 5.6 Belgium 8.1 8.1 8.1 2.5 2.4 2.5 2.6 2.6 2.6 Bulgaria 14.5 15.1 11.3 13.2 13.3 12.2 13.3 13.2 13.8 Czechia 9.1 8.9 9.6 6.9 6.9 6.8 5.8 6.0 5.4 Denmark 3.1 3.1 2.6 3.7 3.6 4.3 3.6 3.5 4.0 Germany 5.2 5.6 3.9 5.7 5.5 6.5 4.3 4.1 4.9 Estonia 9.6 9.5 9.7 4.6 4.6 4.6 7.9 8.1 7.5 Ireland 13.9 5.7 68.1 7.3 6.5 11.3 5.8 5.4 7.4 Greece 7.9 8.2 6.5 11.6 10.4 16.2 0.9 0.0 4.7 Spain 5.4 4.6 7.5 4.9 4.9 4.8 5.2 4.8 6.5 France 4.1 4.2 3.8 3.3 2.8 4.5 3.1 2.7 4.1 Croatia 14.7 14.7 15.0 12.2 12.1 12.3 11.3 11.3 11.2 Italy 3.1 3.2 2.9 3.5 3.5 3.4 5.0 4.8 5.6 Cyprus 5.0 5.0 5.1 4.5 5.0 1.9 4.4 4.9 1.6 Latvia 12.2 12.6 10.5 11.2 11.3 11.1 13.4 13.0 15.2 Lithuania 11.9 12.1 6.8 10.7 10.5 13.9 9.8 9.6 15.2 Luxembourg 8.0 8.0 7.8 3.7 3.6 4.8 0.7 0.7 0.7 Hungary 15.7 16.0 13.7 11.8 12.1 9.1 12.9 13.0 11.7 Malta 4.9 4.9 6.1 1.2 1.0 3.4 3.2 3.1 5.2 Netherlands 6.1 6.3 5.1 5.3 4.8 7.2 5.9 5.5 7.5 Austria 7.4 7.2 8.1 8.0 7.8 8.6 9.5 9.2 10.9 Poland 11.5 11.5 11.4 10.6 10.6 10.4 10.1 10.1 10.1 Portugal 5.2 4.9 6.2 8.9 8.9 8.9 8.2 8.2 8.1 Romania 14.4 14.6 9.8 14.4 14.5 13.8 15.8 15.8 15.3 Slovenia 5.4 5.5 5.0 7.7 7.8 7.4 5.5 5.5 5.2 Slovakia 8.2 9.2 5.2 8.3 6.7 13.1 7.3 5.8 11.7 Finland 4.3 4.2 4.8 1.3 2.1 -2.5 1.4 2.2 -2.5 Sweden 3.9 4.7 2.3 4.4 4.2 5.0 4.3 4.0 5.0 Norway 7.8 5.3 23.1 5.9 5.5 6.0 7.2 7.5 5.8 Iceland 9.1 9.1 8.9 2.6 2.6 2.6 6.9 7.0 6.8 Labour cost data are subject to revision, in particular for the latest quarters, when new source data become available. TOTAL = total labour costs WAGES = wage and salary costs OTHER = non-wage costs : not available Source dataset: lc_lci_r2_q Nominal hourly labour costs of mainly non-business economy (NACE Rev. 2 sections O to S) % change compared with same quarter of previous year - calendar adjusted Q3 2023 Q2 2024 Q3 2024 TOTAL WAGES OTHER TOTAL WAGES OTHER TOTAL WAGES OTHER Euro area 4.0 4.3 3.3 5.6 5.4 6.4 4.6 4.5 4.8 EU 4.6 4.8 3.9 6.1 6.0 6.2 5.1 5.2 4.8 Belgium 7.4 7.5 7.0 2.8 2.7 3.0 2.7 2.6 2.9 Bulgaria 15.7 16.8 11.3 22.9 22.9 22.9 11.2 10.9 12.5 Czechia 5.6 5.9 4.5 5.2 5.3 5.1 4.0 4.1 3.6 Denmark 2.6 2.5 2.8 7.2 7.4 5.5 5.4 5.3 5.9 Germany 3.9 4.4 2.8 6.7 6.0 8.6 4.0 3.8 4.7 Estonia 14.6 14.6 14.6 3.4 3.4 3.5 10.0 9.7 10.7 Ireland 4.5 7.6 :c 5.1 5.2 :c 4.2 4.2 :c Greece 4.7 4.9 4.4 5.9 5.8 5.9 -8.2 -7.8 -9.4 Spain 5.5 4.6 8.4 2.3 2.0 3.3 4.5 4.6 4.2 France 3.0 3.0 3.2 4.8 4.6 5.2 3.0 2.8 3.4 Croatia 19.4 19.4 19.5 29.0 29.1 28.9 21.8 21.8 21.7 Italy 1.0 1.2 0.3 5.8 5.7 6.1 6.1 5.9 6.9 Cyprus 7.2 8.0 5.0 3.1 3.8 1.2 3.3 4.0 1.2 Latvia 11.1 11.5 9.6 10.6 10.3 11.7 12.8 12.1 15.7 Lithuania 10.2 10.2 10.5 11.8 12.0 7.5 13.8 13.6 18.4 Luxembourg 7.2 7.2 7.2 4.0 4.0 3.3 1.6 1.6 1.2 Hungary 14.0 14.2 12.6 15.2 15.2 15.4 16.5 16.7 15.2 Malta 4.1 4.4 1.8 4.6 4.7 2.8 7.1 7.6 2.5 Netherlands 5.4 6.2 3.2 6.2 6.5 5.4 6.1 6.0 6.4 Austria 2.8 2.5 3.6 8.5 8.8 7.7 12.7 12.6 12.8 Poland 14.1 14.1 14.1 20.2 20.2 19.9 16.7 16.7 16.6 Portugal 4.8 4.4 6.7 4.9 5.0 4.7 8.7 8.8 8.6 Romania 16.3 16.7 7.9 16.7 16.7 16.5 20.7 20.7 20.2 Slovenia 3.5 3.7 2.4 2.1 2.2 1.6 2.0 1.9 2.3 Slovakia 5.7 6.0 5.1 11.0 10.2 13.1 7.8 7.1 9.9 Finland 3.7 3.4 4.9 1.5 2.2 -1.9 2.6 3.4 -0.7 Sweden 5.4 3.4 9.6 1.4 2.9 -1.7 1.1 2.3 -1.4 Norway 7.8 7.4 10.5 5.5 5.5 4.9 4.4 4.3 5.4 Iceland 8.7 8.6 9.0 -0.9 -1.1 -0.3 3.4 3.3 3.9 Labour cost data are subject to revision, in particular for the latest quarters, when new source data become available. : not available c confidential TOTAL = total labour costs WAGES = wage and salary costs OTHER = non-wage costs Source dataset: lc_lci_r2_q Nominal hourly labour costs by main economic activity branches for the business economy Nominal hourly labour costs of Industry (NACE Rev. 2 sections B to E) % change compared with same quarter of previous year - calendar adjusted Q3 2023 Q2 2024 Q3 2024 TOTAL WAGES OTHER TOTAL WAGES OTHER TOTAL WAGES OTHER Euro area 5.2 5.5 4.4 5.1 5.0 5.6 4.6 4.4 5.3 EU 5.7 6.1 4.7 5.6 5.5 5.9 5.3 5.1 5.6 Belgium 6.9 6.9 6.9 3.6 3.7 3.6 3.1 3.1 3.1 Bulgaria 16.2 16.6 13.9 11.2 11.2 11.0 11.4 11.2 12.5 Czechia 8.8 8.9 8.6 8.1 8.1 7.9 5.5 5.6 5.3 Denmark 2.3 2.4 2.0 4.5 4.6 4.3 4.3 4.3 4.1 Germany 4.8 5.6 2.4 5.2 5.0 6.0 3.9 3.8 4.4 Estonia 6.6 6.2 7.7 6.7 6.8 6.3 9.3 9.7 8.1 Ireland 10.4 5.8 36.1 6.0 5.5 9.6 5.0 5.0 5.5 Greece 2.4 2.6 1.6 7.8 7.0 10.8 4.7 2.8 11.9 Spain 4.3 3.4 7.0 4.9 5.1 4.1 5.5 5.2 6.3 France 4.3 4.3 4.2 3.9 3.3 5.2 3.5 3.1 4.4 Croatia 14.2 14.2 14.4 13.6 13.7 13.1 13.0 13.0 13.2 Italy 4.9 5.2 4.1 5.0 5.1 4.8 5.4 5.2 6.0 Cyprus 6.3 6.2 6.6 4.7 5.3 1.9 4.3 4.8 1.7 Latvia 12.1 12.7 9.9 9.6 9.6 9.4 12.0 11.3 14.5 Lithuania 11.0 11.0 :c 9.5 9.7 :c 11.0 11.2 :c Luxembourg 8.4 8.3 9.5 5.2 5.2 5.6 0.7 0.8 -0.2 Hungary 17.2 17.5 15.1 11.0 11.3 8.6 12.7 12.9 11.7 Malta 4.2 4.4 0.8 4.9 4.1 16.1 8.8 8.4 14.4 Netherlands 5.5 5.8 4.4 4.4 4.1 5.6 :c :c :c Austria 7.7 7.6 8.0 7.8 7.7 8.1 7.2 6.7 8.9 Poland 10.6 10.7 10.5 10.1 10.2 10.0 11.0 11.0 11.1 Portugal 5.2 5.0 5.7 10.4 10.4 10.3 10.4 10.4 10.4 Romania 13.9 14.3 7.7 13.1 13.1 12.9 15.1 15.1 14.8 Slovenia 3.3 3.3 3.1 8.2 8.2 8.1 5.3 5.1 6.0 Slovakia 8.0 9.0 4.9 9.2 7.6 13.9 7.7 6.5 11.4 Finland 3.4 3.2 4.3 2.5 3.6 -2.7 1.6 2.5 -2.6 Sweden 3.4 4.3 1.5 4.8 4.5 5.4 4.2 3.8 5.0 Norway 9.1 5.5 31.2 4.6 4.4 2.4 6.2 6.7 4.2 Iceland 8.9 8.9 8.7 2.9 3.0 2.4 11.5 11.9 10.0 Labour cost data are subject to revision, in particular for the latest quarters, when new source data become available. : not available c confidential TOTAL = total labour costs WAGES = wage and salary costs OTHER = non-wage costs Source dataset: lc_lci_r2_q Nominal hourly labour costs of Construction (NACE Rev. 2 section F) % change compared with same quarter of previous year - calendar adjusted Q3 2023 Q2 2024 Q3 2024 TOTAL WAGES OTHER TOTAL WAGES OTHER TOTAL WAGES OTHER Euro area 6.0 5.1 8.9 5.6 5.2 6.7 5.0 4.6 6.2 EU 6.3 5.5 8.6 6.0 5.8 6.7 5.5 5.2 6.3 Belgium 8.3 8.3 8.3 1.7 1.7 1.7 2.3 2.3 2.3 Bulgaria 17.0 17.5 14.3 19.5 20.8 12.8 12.9 13.4 10.6 Czechia 8.9 8.9 9.1 6.7 6.7 6.5 6.9 7.1 6.4 Denmark 3.2 3.4 1.7 3.1 3.0 4.3 3.7 3.8 3.5 Germany 4.9 4.8 5.0 6.2 5.8 7.3 4.7 4.4 5.7 Estonia 3.6 3.4 3.9 3.2 3.7 2.0 6.3 6.7 5.1 Ireland :c 5.3 :c :c 10.2 :c :c 5.2 :c Greece 6.5 4.9 12.0 12.9 11.9 16.4 3.4 1.9 8.2 Spain 6.4 5.3 9.2 3.1 1.8 6.6 3.4 3.0 4.3 France 3.5 3.7 2.7 3.2 2.7 4.9 3.7 3.2 5.2 Croatia 19.2 19.3 18.9 10.6 10.6 10.6 9.9 10.0 9.5 Italy 3.5 3.5 3.5 7.7 8.0 7.0 4.8 4.7 5.1 Cyprus 3.8 3.8 4.0 2.1 2.2 1.9 4.1 4.5 2.1 Latvia 10.6 10.9 9.1 13.7 13.8 13.2 15.0 14.8 15.9 Lithuania 18.2 17.9 25.4 14.7 14.5 19.3 11.6 11.6 12.3 Luxembourg 7.5 7.4 7.8 5.2 5.2 5.3 2.2 2.2 2.3 Hungary 13.0 12.9 13.2 13.6 13.9 10.7 15.4 15.7 13.5 Malta 1.3 1.6 -1.8 2.2 2.2 1.1 3.3 3.4 2.7 Netherlands 3.5 4.3 0.7 4.5 4.5 4.4 :c :c :c Austria 8.3 8.0 9.5 9.9 8.3 15.5 11.0 8.8 19.0 Poland 7.0 7.0 7.0 14.2 14.2 14.1 13.0 13.0 13.1 Portugal 6.1 4.4 12.7 8.9 8.9 8.8 8.6 8.6 8.5 Romania 21.6 21.9 13.8 19.8 19.8 19.7 19.1 19.1 19.1 Slovenia 6.2 6.4 5.0 13.6 14.0 11.4 6.0 6.1 5.5 Slovakia 10.9 12.9 5.2 16.1 13.9 22.9 10.7 8.3 18.2 Finland 3.4 3.3 4.1 4.1 4.9 0.3 2.8 3.7 -1.1 Sweden 5.1 4.9 5.7 4.2 4.1 4.6 3.8 3.6 4.2 Norway 5.2 3.6 14.7 4.9 4.8 4.5 6.9 7.3 5.1 Iceland 9.3 9.2 9.3 3.6 3.7 3.3 6.8 6.8 6.7 Labour cost data are subject to revision, in particular for the latest quarters, when new source data become available. c confidential : not available TOTAL = total labour costs WAGES = wage and salary costs OTHER = non-wage costs Source dataset: lc_lci_r2_q Nominal hourly labour costs of Services (NACE Rev. 2 sections G to N) % change compared with same quarter of previous year - calendar adjusted Q3 2023 Q2 2024 Q3 2024 TOTAL WAGES OTHER TOTAL WAGES OTHER TOTAL WAGES OTHER Euro area 5.5 5.5 5.4 4.8 4.6 5.4 4.5 4.3 5.3 EU 5.8 5.9 5.5 5.2 5.0 5.5 4.9 4.7 5.4 Belgium 8.6 8.6 8.5 2.1 2.1 2.1 2.4 2.4 2.5 Bulgaria 13.5 14.2 9.5 13.6 13.7 12.8 14.3 14.2 14.8 Czechia 9.4 9.0 10.5 5.9 5.9 5.9 5.9 6.1 5.4 Denmark 3.3 3.4 2.9 3.4 3.3 4.4 3.3 3.2 4.1 Germany 5.5 5.7 4.7 6.0 5.8 6.7 4.4 4.2 5.1 Estonia 11.9 12.1 11.5 3.9 3.8 4.2 7.5 7.6 7.5 Ireland 10.6 5.7 43.7 7.2 6.4 11.8 5.5 5.6 5.4 Greece 9.7 10.1 7.8 12.7 11.4 18.0 -0.4 -1.0 1.9 Spain 5.7 5.0 7.5 5.1 5.2 4.8 5.4 4.8 6.8 France 4.0 4.1 3.8 3.1 2.6 4.3 2.9 2.5 3.9 Croatia 14.4 14.3 14.7 11.7 11.7 12.2 10.7 10.8 10.5 Italy 2.0 2.0 2.1 1.9 1.9 1.8 4.8 4.6 5.4 Cyprus 5.0 5.0 5.0 4.8 5.3 1.9 4.5 5.0 1.6 Latvia 12.4 12.8 10.9 11.5 11.5 11.5 13.8 13.4 15.4 Lithuania 11.5 11.8 3.4 10.6 10.3 17.1 9.1 8.7 19.4 Luxembourg 8.0 8.1 7.5 3.3 3.2 4.6 0.6 0.6 0.6 Hungary 15.1 15.4 12.9 12.1 12.4 9.2 12.7 12.9 11.5 Malta 5.3 5.3 8.3 0.5 0.4 1.1 2.3 2.2 3.6 Netherlands 6.5 6.7 5.8 5.6 5.0 8.0 :c :c :c Austria 7.1 6.9 8.0 7.8 7.7 7.9 10.6 10.5 10.7 Poland 12.7 12.7 12.6 10.5 10.6 10.3 9.1 9.1 9.2 Portugal 5.2 5.1 5.6 8.2 8.2 8.2 7.1 7.1 6.9 Romania 13.6 13.7 10.8 14.3 14.3 13.6 15.7 15.7 15.1 Slovenia 7.0 7.1 6.3 6.6 6.7 6.2 5.6 5.7 4.6 Slovakia 8.1 9.0 5.4 7.1 5.5 11.8 6.7 5.1 11.5 Finland 4.9 4.9 5.3 0.3 0.9 -2.8 1.1 1.9 -2.7 Sweden 3.9 4.8 2.0 4.4 4.1 4.9 4.4 4.1 5.1 Norway 7.8 5.5 21.9 6.6 6.1 7.7 7.6 7.8 6.6 Iceland 9.1 9.1 9.0 2.4 2.3 2.7 5.3 5.2 5.7 Labour cost data are subject to revision, in particular for the latest quarters, when new source data become available. c confidential : not available TOTAL = total labour costs WAGES = wage and salary costs OTHER = non-wage costs Source dataset: lc_lci_r2_q Nominal hourly labour costs of wage and non-wage component by NACE Rev. 2 sections in the EU % change compared with the same quarter of the previous year - calendar adjusted Q3 2023 Q2 2024 Q3 2024 TOTAL WAGES OTHER TOTAL WAGES OTHER TOTAL WAGES OTHER B: Mining and quarrying 4.9 4.7 5.4 4.3 4.9 2.3 2.8 2.6 3.2 C: Manufacturing 5.7 6.1 4.7 5.8 5.6 6.1 5.3 5.2 5.7 D: Electricity, gas, steam and air conditioning supply 6.5 7.3 4.2 4.3 4.6 3.7 4.9 5.2 4.2 E: Water supply; sewerage, waste management and remediation activities 5.3 5.6 4.2 4.5 4.5 4.4 5.2 5.0 5.8 F: Construction 6.3 5.5 8.6 6.0 5.8 6.7 5.5 5.2 6.3 G: Wholesale and retail trade; repair of motor vehicles and motorcycles 5.9 5.7 6.7 5.3 5.3 5.6 5.1 4.9 5.7 H: Transport and storage 6.5 6.6 6.3 4.6 4.4 5.3 5.3 5.1 6.0 I: Accommodation and food service activities 5.9 5.8 6.2 4.9 4.7 5.3 5.1 4.7 6.6 J: Information and communication 5.4 5.7 4.1 5.0 5.1 5.0 5.0 5.0 4.9 K: Financial and insurance activities 4.9 5.2 4.1 4.9 4.9 4.8 4.5 4.5 4.6 L: Real estate activities 2.1 2.2 1.7 5.1 5.4 4.2 4.4 4.5 4.1 M: Professional, scientific and technical activities 5.4 5.7 4.3 5.6 5.7 5.2 4.3 4.1 5.0 N: Administrative and support service activities 6.8 6.8 6.6 5.2 4.4 7.8 4.9 4.6 5.9 O: Public administration and defense; compulsory social security 4.6 4.8 3.9 5.6 5.4 6.2 4.5 4.6 4.3 P: Education 4.7 5.0 3.6 7.8 7.6 8.2 5.9 6.2 5.3 Q: Human health and social work activities 4.5 4.5 4.4 5.6 5.7 5.1 5.0 5.0 4.8 R: Arts, entertainment and recreation 4.9 5.5 2.8 6.3 6.6 5.0 6.6 7.0 5.1 S: Other service activities 4.5 5.1 2.5 4.8 4.7 5.3 4.4 4.1 5.1 Labour cost data are subject to revision, in particular for the latest quarters, when new source data become available. TOTAL = total labour costs WAGES = wage and salary costs OTHER = non-wage costs Source dataset: lc_lci_r2_q Notes for users Revisions and timetable The Labour Cost Index data are subject to revision, in particular for the latest quarters, when new source data become available. The original data, before any subsequent revision, are also available here. Compared with the News Release of 16 September 2024, the annual growth rate of the hourly labour costs, for the total economy in the second quarter of 2024 was revised from +4.7% to +5.2% for the euro area and from +5.2% to +5.6% for the EU. Eurostat releases early estimates for the hourly labour costs of the euro area and of the EU, around 50 days after the reference quarter. Early estimates for the third quarter of 2024 have been released on 19 November 2024 and early estimates for the fourth quarter are scheduled on 19 February 2025. In the case of Ireland, the annual growth of hourly wages was impacted downwards by the phasing out of the Employment Wage Subsidy Scheme (EWSS) introduced by government in March 2020 to support wages during the COVID-19 pandemic. It enabled employees, whose employers
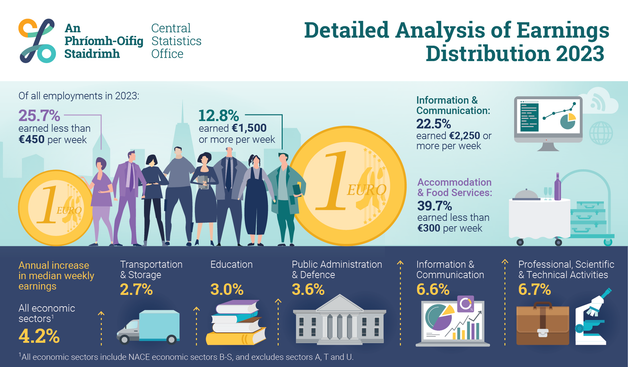
Median weekly earnings were up 4.2% in the 12 months to 2023
#CSOIreland #Ireland #Earnings #LabourCosts #LabourMarket #BusinessStatistics #Business #BusinessNews #IrishBusiness
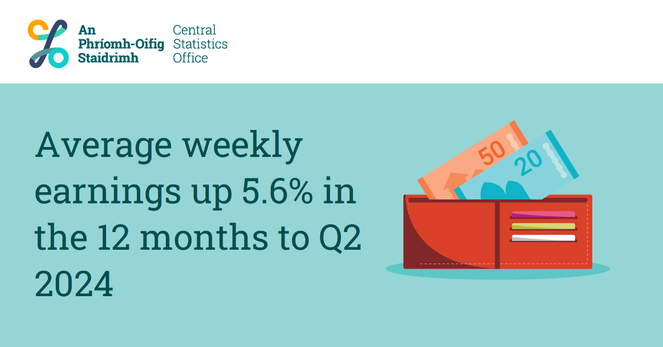
Average weekly earnings up 5.6% in the 12 months to Q2 2024
https://www.cso.ie/en/releasesandpublications/ep/p-elcq/earningsandlabourcostsq12024finalq22024preliminaryestimates/?utm_source=Mastodon&utm_medium=Mastodon&utm_campaign=ELCQ124FQ224P
#CSOIreland #Ireland #Earnings #LabourCosts #LabourMarket #BusinessStatistics #Business #BusinessNews #IrishBusiness