Indicators of Global Climate Change 2024: annual update of key indicators of the state of the climate system and human influence
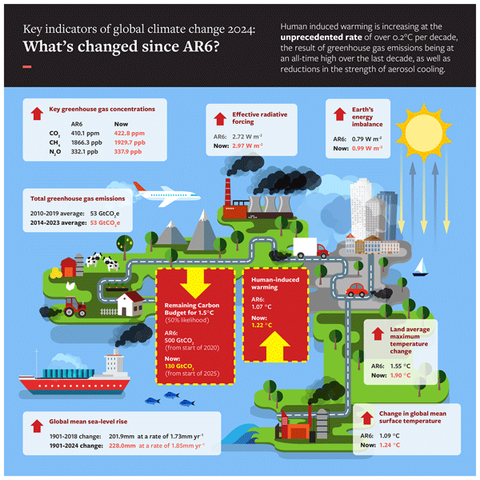
Abstract. In a rapidly changing climate, evidence-based decision-making benefits from up-to-date and timely information. Here we compile monitoring datasets (published at https://doi.org/10.5281/zenodo.15639576; Smith et al., 2025a) to produce updated estimates for key indicators of the state of the climate system: net emissions of greenhouse gases and short-lived climate forcers, greenhouse gas concentrations, radiative forcing, the Earth's energy imbalance, surface temperature changes, warming attributed to human activities, the remaining carbon budget, and estimates of global temperature extremes. This year, we additionally include indicators for sea-level rise and land precipitation change. We follow methods as closely as possible to those used in the IPCC Sixth Assessment Report (AR6) Working Group One report. The indicators show that human activities are increasing the Earth's energy imbalance and driving faster sea-level rise compared to the AR6 assessment. For the 2015–2024 decade average, observed warming relative to 1850–1900 was 1.24 [1.11 to 1.35] °C, of which 1.22 [1.0 to 1.5] °C was human-induced. The 2024-observed best estimate of global surface temperature (1.52 °C) is well above the best estimate of human-caused warming (1.36 °C). However, the 2024 observed warming can still be regarded as a typical year, considering the human-induced warming level and the state of internal variability associated with the phase of El Niño and Atlantic variability. Human-induced warming has been increasing at a rate that is unprecedented in the instrumental record, reaching 0.27 [0.2–0.4] °C per decade over 2015–2024. This high rate of warming is caused by a combination of greenhouse gas emissions being at an all-time high of 53.6±5.2 Gt CO2e yr−1 over the last decade (2014–2023), as well as reductions in the strength of aerosol cooling. Despite this, there is evidence that the rate of increase in CO2 emissions over the last decade has slowed compared to the 2000s, and depending on societal choices, a continued series of these annual updates over the critical 2020s decade could track decreases or increases in the rate of the climatic changes presented here.
Indicators of Global Climate Change 2024: annual update of key indicators of the state of the climate system and human influence
Abstract. In a rapidly changing climate, evidence-based decision-making benefits from up-to-date and timely information. Here we compile monitoring datasets (published at https://doi.org/10.5281/zenodo.15639576; Smith et al., 2025a) to produce updated estimates for key indicators of the state of the climate system: net emissions of greenhouse gases and short-lived climate forcers, greenhouse gas concentrations, radiative forcing, the Earth's energy imbalance, surface temperature changes, warming attributed to human activities, the remaining carbon budget, and estimates of global temperature extremes. This year, we additionally include indicators for sea-level rise and land precipitation change. We follow methods as closely as possible to those used in the IPCC Sixth Assessment Report (AR6) Working Group One report. The indicators show that human activities are increasing the Earth's energy imbalance and driving faster sea-level rise compared to the AR6 assessment. For the 2015–2024 decade average, observed warming relative to 1850–1900 was 1.24 [1.11 to 1.35] °C, of which 1.22 [1.0 to 1.5] °C was human-induced. The 2024-observed best estimate of global surface temperature (1.52 °C) is well above the best estimate of human-caused warming (1.36 °C). However, the 2024 observed warming can still be regarded as a typical year, considering the human-induced warming level and the state of internal variability associated with the phase of El Niño and Atlantic variability. Human-induced warming has been increasing at a rate that is unprecedented in the instrumental record, reaching 0.27 [0.2–0.4] °C per decade over 2015–2024. This high rate of warming is caused by a combination of greenhouse gas emissions being at an all-time high of 53.6±5.2 Gt CO2e yr−1 over the last decade (2014–2023), as well as reductions in the strength of aerosol cooling. Despite this, there is evidence that the rate of increase in CO2 emissions over the last decade has slowed compared to the 2000s, and depending on societal choices, a continued series of these annual updates over the critical 2020s decade could track decreases or increases in the rate of the climatic changes presented here.
Im Ergebnis sehen wir, dass die Energiebilanz der Erdatmosphäre außer Kontrolle gerät. Die Geschwindigkeit, mit der die Atmosphäre sich mit Energie vollpumpt, nimmt stetig zu.
#DiagramsOfDoom
#Klimakatastrophe
#Artenkollaps
[2]
Im Ergebnis sehen wir, dass die Energiebilanz der Erdatmosphäre außer Kontrolle gerät. Die Geschwindigkeit, mit der die Atmosphäre sich mit Energie vollpumpt, nimmt stetig zu.
#DiagramsOfDoom
#Klimakatastrophe
#Artenkollaps
[2]
Vor wenigen Stunden wurde ein verheerender Bericht veröffentlicht, der aufgezeigt, daß die Beobachtungsdaten zur #Klimakatastrophe eine Beschleunigung der Klimaveränderung aufzeigen. Die Vorhersagen des @ipcc.bsky.social AR6 werden übertroffen!
#DiagramsOfDoom
#BiodiversityCollapse
[1]
Vor wenigen Stunden wurde ein verheerender Bericht veröffentlicht, der aufgezeigt, daß die Beobachtungsdaten zur #Klimakatastrophe eine Beschleunigung der Klimaveränderung aufzeigen. Die Vorhersagen des @ipcc.bsky.social AR6 werden übertroffen!
#DiagramsOfDoom
#BiodiversityCollapse
[1]
@climate.noaa.gov
zeigt auf, dass die CO2-Konzentration in der Atmosphäre weiterhin rapide ansteigt.
Das brennende Auto rast auf mit Vollgas auf die Todesklippe zu. Diese Zahlen offenbaren die Spuren der Umweltzerstörung.
[3]
#DoD
#DiagramsOfDoom
#ClimateCatastrophe
#BiodiversityCollapse
@climate.noaa.gov
zeigt auf, dass die CO2-Konzentration in der Atmosphäre weiterhin rapide ansteigt.
Das brennende Auto rast auf mit Vollgas auf die Todesklippe zu. Diese Zahlen offenbaren die Spuren der Umweltzerstörung.
[3]
#DoD
#DiagramsOfDoom
#ClimateCatastrophe
#BiodiversityCollapse
#DoD - #DiagramsOfDoom
Die Welt steuert mit zunehmender Geschwindigkeit auf #Klimakatastrophe & #Artenkollaps zu. Die Daten sind eindeutig.
Die Bedrohung für die Zivilisation ist so offensichtlich, dass nur der Wille zur Zerstörung uns davon abhält, die notwendigen Veränderungen umzusetzen.
[1]
#DoD - #DiagramsOfDoom
Die Welt steuert mit zunehmender Geschwindigkeit auf #Klimakatastrophe & #Artenkollaps zu. Die Daten sind eindeutig.
Die Bedrohung für die Zivilisation ist so offensichtlich, dass nur der Wille zur Zerstörung uns davon abhält, die notwendigen Veränderungen umzusetzen.
[1]


