Provided by @altbot, generated privately and locally using Gemma4:26b
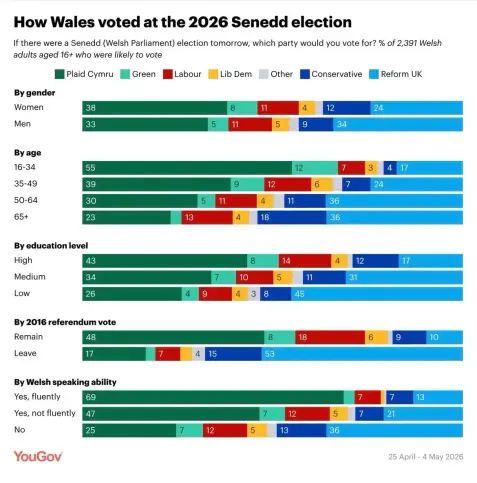
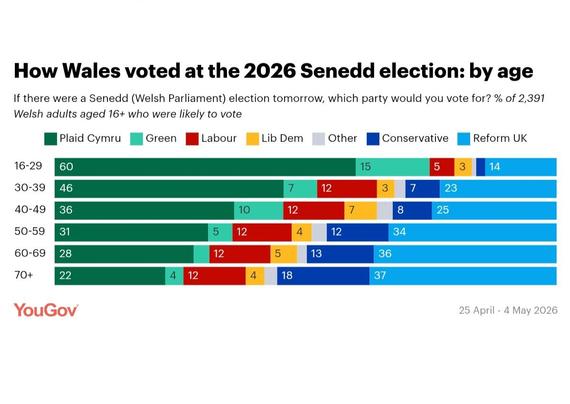
@2legged A screenshot of a webpage featuring a stacked bar chart titled "How Wales voted at the 2026 Senedd election: by age". Below the title, the text asks, asks, "If there were a Senedd (Welsh Parliament) election tomorrow, which party would you vote for? % of 2,391 Welsh adults aged 16+". The chart's legend lists "Plaid Cymru", "Green", "Labour", "Lib Dem", "Other", "Conservative", and "Reform UK". The bar chart displays data for six age groups: 16-29, 30-39, 40-49, 50-59, 60-69, and 70+, with the following numbers visible in the segments: 16-29 (60, 5, 3, 14); 30-39 (46, 7, 12, 3, 3, 7, 23); 40-49 (36, 10, 12, 7, 8, 25); 50-59 (31, 5, 12, 4, 12, 34); 60-6 60-69 (28, 12, 5, 13, 36); and 70+ (22, 4, 14, 4, 18, 37). Fragmented text at the top of the image discusses voting percentages for Plaid Cymru and Reform UK, and the text "How Wales voted in 2026. by gender" is visible at the bottom.
🌱 Energy used: 0.998 Wh