Provided by @altbot, generated privately and locally using Gemma4:26b
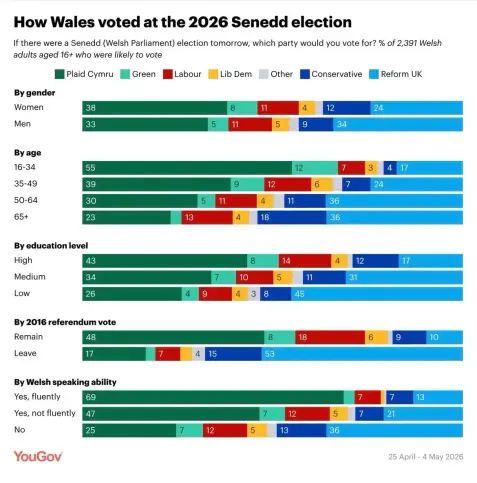
@2legged An infographic titled "How Wales voted at the 2026 Senedd election" includes the text, "If there were a Senedd (Welsh Parliament) election tomorrow, which party would you vote for? % of 2,391 Welsh adults aged 16+ who were likely to vote." A legend lists "Plaid Cymru Green Labour Lib Dem Other Conservative Reform UK". The graphic features horizontal stacked bar charts categorized by "By gender" (Women: 38, 8, 11, 4, 12, 24; Men: 33, 5, 5, 11, 5, 9, 34), "By age" (16-34: 55, 12, 7, 3, 4, 17; 35-49: 39, 9, 12, 6 6, 7, 24; 50-64: 30, 5, 11, 4, 11, 36; 65+: 23, 13, 4, 18, 3, 36), "By education level" (High: 43, 8, 14, 4, 12, 17; Medium: 34, 7, 10, 5, 11, 31; 31; Low: 26, 4, 9, 4, 3, 45), "By 2016 referendum vote" (Remain: 48, 8, 18, 18, 6, 9, 10; Leave: 17, 7, 4, 15, 53), and "By Welsh speaking ability" (Ye (Yes, fluently: 69, 7, 7, 13; Yes, not fluently: 47, 7, 12, 5, 7, 21; No: 2 25, 7, 12, 5, 13, 36). The footer shows the "YouGov" logo and the date "25 April - 4 May 2026".
🌱 Energy used: 1.664 Wh