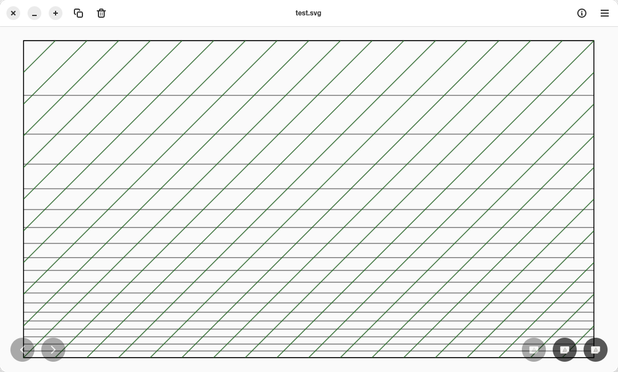
i have implemented the isobars and isotherms of a Skew-T Log-P. It is now time to plot data, goddammit
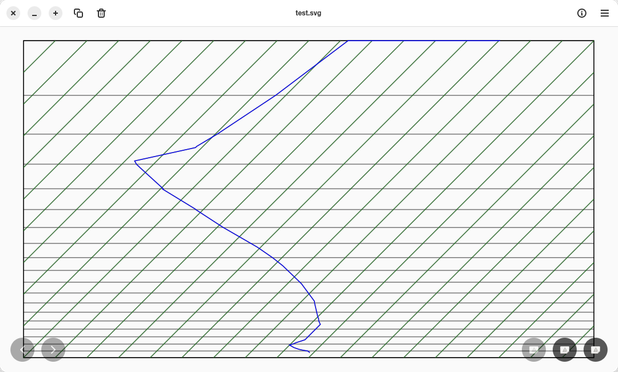
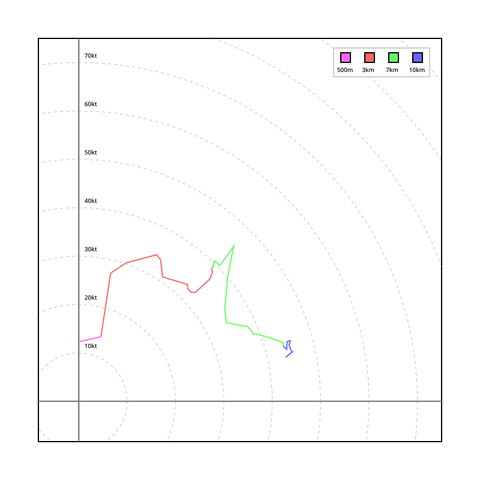
Heyoooooo! My rendering works! Here's a random sounding from the IGRA archives from, uhh, 1968 (there's no dewpoint data collected here)
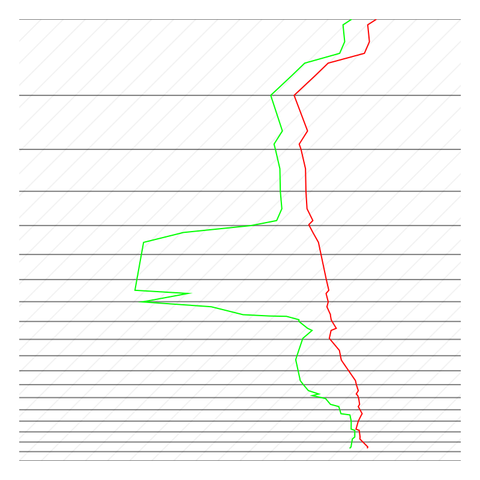
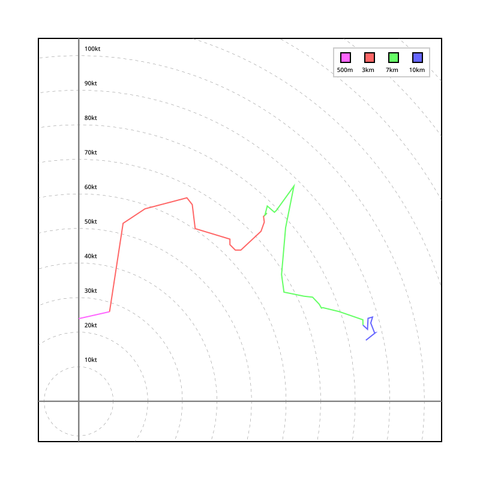
A lot more hacking later, and I am able to plot data one in the weather enterprise would be very familiar with, looking as it should.
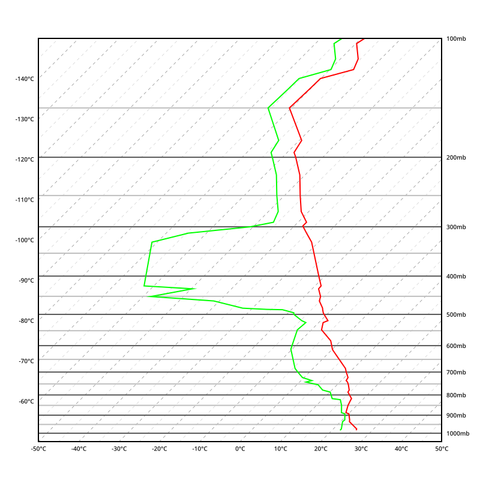
I now consider this complete, with legends and better readability for isotherms.