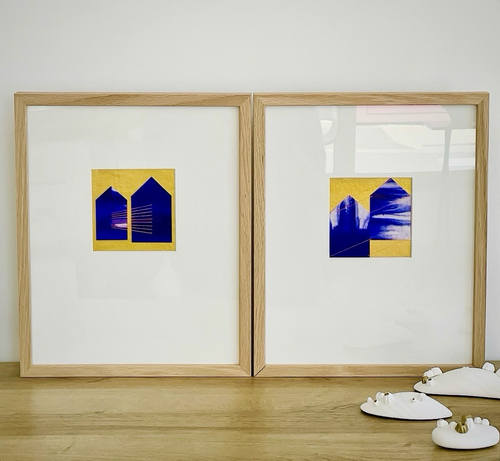
Spatialité et perspectives.
.
#spatialite #perspective #ultraviolet #or #lignes @gaellethuayre @gaellethuayre_atelier
.
#spatialite #perspective #ultraviolet #or #lignes @gaellethuayre @gaellethuayre_atelier
SQLite와 Rails에서 SpatiaLite를 활용한 공간 데이터 쿼리 구현하기
SQLite의 공간 데이터 확장 라이브러리인 SpatiaLite를 활용하면 PostGIS 없이도 Rails 환경에서 복잡한 지리 정보 시스템(GIS) 기능을 구현할 수 있다.
oh boy, `spatialite` doesn't use a geographic index? You need to do this complicated nested queries to use it?
🤯🤯🤯
Maybe I need to switch to #postgis
#sqlite #gis #spatialite
Message d'Alexandree Chèvremont
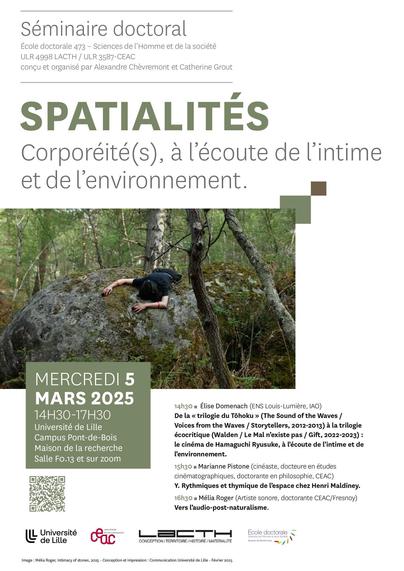
Le mercredi 5 mars, Catherine Grout et moi avons l'immense plaisir d'inviter Elise Domenach et les deux doctorantes dont je dirige le travail de thèse, Mélia Roger et Marianne Pistone, pour ce séminaire doctoral autour des spatialités. Lien Zoom en QR code sur l'affiche et ici : https://univ-lille-fr.zoom.us/j/97731941874...
#ecoute #environnement #corporalite #recherche #spatialite #séminaire
Zoom is the leader in modern enterprise video communications, with an easy, reliable cloud platform for video and audio conferencing, chat, and webinars across mobile, desktop, and room systems. Zoom Rooms is the original software-based conference room solution used around the world in board, conference, huddle, and training rooms, as well as executive offices and classrooms. Founded in 2011, Zoom helps businesses and organizations bring their teams together in a frictionless environment to get more done. Zoom is a publicly traded company headquartered in San Jose, CA.
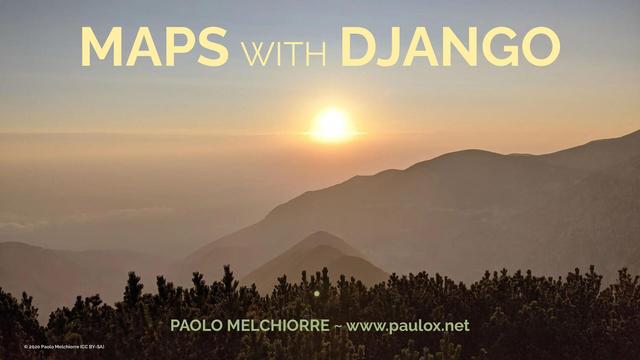
The video recording of my talk "Maps with Django" presented in Durham, USA, during DjangoCon US 2024 is finally online 🚀
I talked about Django, Maps, GeoDjango, SQLite, SpatiaLite, PostgreSQL, PostGIS and Leaflet 🗺️
https://www.paulox.net/2024/09/24/djangocon-us-2024/
CC @djangocon
#DjangoCon #DjangoConUS #Django #Maps #GeoDjango #SQLite #SpatiaLite #PostgreSQL #PostGIS #Leaflet

DjangoCon US is a six-day international conference for the community by the community about the Django web framework, held each year in North America.
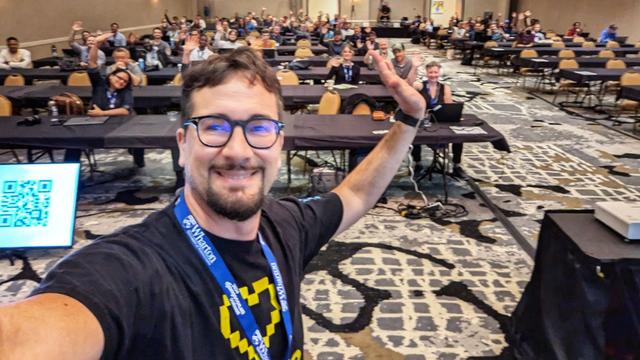
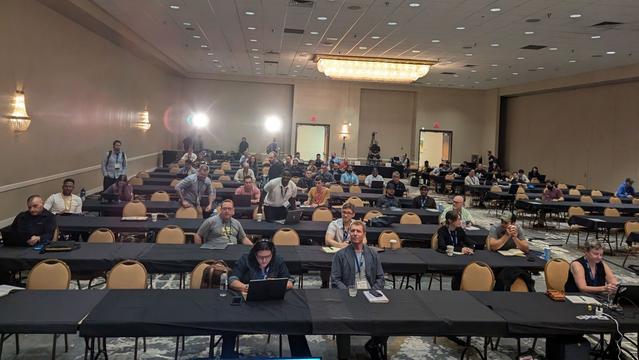
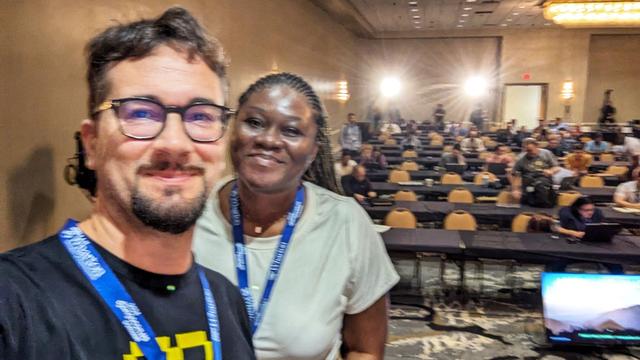
This morning I presented the talk "Maps with Django" at DjangoCon US 2024 in Durham, North Carolina (US) 🇺🇲
It was a great experience, and I thank the organizers and volunteers 🤗
You can find slides and info here 👇
https://www.paulox.net/2024/09/24/djangocon-us-2024/
#Django #DjangoCon #GeoDjango #Maps #DjangoConUS #DjangoConUS2024 #GIS #PostGIS #PostgreSQL #SQLite #SpatiaLite
CC @djangocon
DjangoCon US is a six-day international conference for the community by the community about the Django web framework, held each year in North America.
Today at 11:30 EST I'll be giving my talk "Maps with Django" at DjangoCon US 2024 in Durham, North Carolina 🇺🇲
I'll wait for you in the "Grand Ballroom III" of the Durham Convention Center, or you can watch it online ☺️
More info 👇
https://www.paulox.net/2024/09/24/djangocon-us-2024/
#DjangoCon #DjangoConUS #DjangoCon2024 #GeoDjango #Django #Maps #Leaflet #PostgGIS #PostgreSQL #SQLite #SpatiaLite #GIS #GDAL
DjangoCon US is a six-day international conference for the community by the community about the Django web framework, held each year in North America.
I have updated my articles on maps with Django with some small improvements and updated dependencies, including Django 5.0 and Python 3.12 🗺️
The first article 👇
https://www.paulox.net/2020/12/08/maps-with-django-part-1-geodjango-spatialite-and-leaflet/
#Django #Map #Python #GeoDjango #GIS #Leaflet #GeoJSON #SpatiaLite #SQLite

A quick-start guide to create a web map with the Python-based web framework Django using its module GeoDjango, the SQLite database with its spatial extension SpatiaLite and Leaflet, a JavaScript library for interactive maps.