New paper. With Ekaterina Vasileva, Liubov Tupikina, Dmitry Fedorov, Daniil Musatov, Andrei Raigorodskii and Stefano Boccaletti.
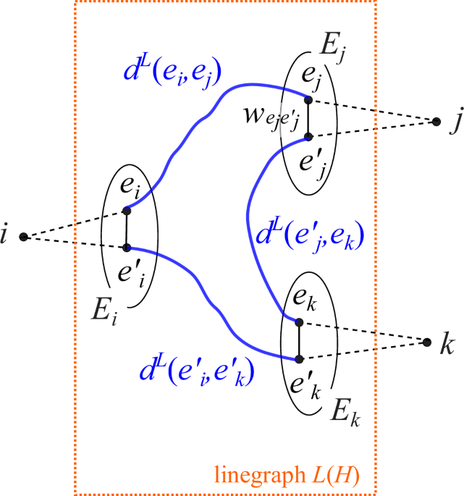
The naive generalization of the concept of distance to hypergraphs is equivalent to applying a clique-projection approximation. However, this is known to induce loss of information, especially in networks where the higher-order interactions are very important. To fix this problem,we introduce a new definition of distance on weighted higher-order networks, which includes the case of unweighted hypergraphs and classic graph distance as particular cases, and allows one to account for different meanings associated to the weights. We also show what difference this makes in analyses of real-world data.
https://www.nature.com/articles/s42005-026-02592-w
#mathematics #physics #graphtheory #graphs #hypergraphs #higherordernetworks #networkscience #networks