The built-in browser tool is good for quick checks.

But when a page looks fine and the console is exploding, I want better evidence.

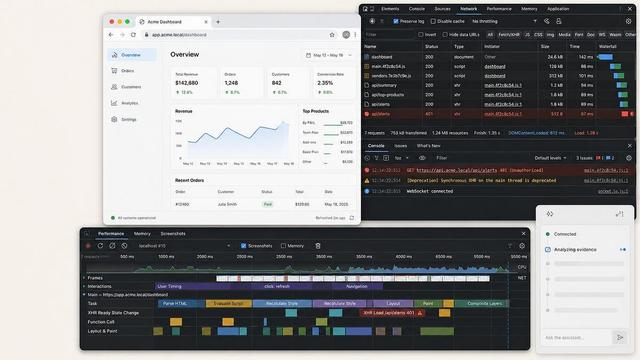
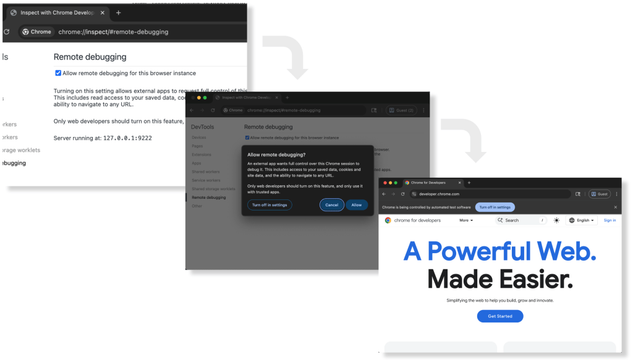
In this article, I show how I connect IBM Bob to a dedicated Chrome session through Chrome DevTools MCP, so Bob can inspect console logs, network requests, screenshots, and performance traces.

My simple rule:

Use the built-in browser tool when speed is enough.
Use Chrome DevTools when you need evidence.

https://www.the-main-thread.com/p/chrome-devtools-mcp-ibm-bob

#Java #AI #MCP #ChromeDevTools

🤦‍♂️ Ah yes, the age-old tale of the DIY coder who thinks they've outsmarted the fintech world with a Rube Goldberg machine of #cronjobs and Chrome DevTools. Spoiler alert: it breaks more often than a New Year's resolution. 💸🔧
https://driggsby.com/blog/claude-code-routine-watch-my-finances #DIYCoding #FintechFails #ChromeDevTools #RubeGoldberg #HackerNews #ngated
Could a Claude Code routine watch my finances? | Driggsby

After tinkering with Claude Code routines, I wondered: how far could I push this?

Driggsby

Github Awesome (@GithubAwesome)

브라우저 자동화가 DOM 변경이나 예상치 못한 팝업에 쉽게 깨지는 문제를 해결하기 위해 Browser-harness가 등장했다. 이 도구는 Chrome에 WebSocket과 Chrome DevTools Protocol로 직접 연결하고, 에이전트가 예기치 않은 상황을 만나면 즉석에서 JavaScript를 주입해 대응한다.

https://x.com/GithubAwesome/status/2045672089525399841

#browserautomation #chromedevtools #javascript #websocket #aiagents

Github Awesome (@GithubAwesome) on X

Most browser automation breaks the moment a site changes its DOM structure or throws an unexpected popup. Browser-harness connects directly to Chrome over WebSocket via Chrome DevTools Protocol. When the agent hits something unexpected, it injects its own JavaScript on the fly to

X (formerly Twitter)

AI 코딩 에이전트가 내 브라우저 세션을 직접 디버그한다, Chrome DevTools MCP 신기능

Chrome DevTools MCP 서버가 활성 브라우저 세션 연결을 지원합니다. 로그인 상태를 유지한 채 AI 에이전트에게 디버깅을 넘길 수 있는 새 기능을 소개합니다.

https://aisparkup.com/posts/10212

Let your Coding Agent debug your browser session with Chrome DevTools MCP  |  Blog  |  Chrome for Developers

We shipped a new feature to the Chrome DevTools MCP server that is going to make it a lot easier for your coding agent to debug your current browser sessions.

Chrome for Developers
🚀🎨 Oh, joy! Yet another #beta toy for the Chrome devs to play with, because clearly, we needed more ways to overcomplicate the web. 🙄 As always, prepare for the inevitable parade of half-baked "features" that will surely redefine the term 'early preview.' 🍿
https://developer.chrome.com/blog/webmcp-epp #ChromeDevTools #Overload #WebDevelopment #Frustration #EarlyPreview #TechHumor #HackerNews #ngated
WebMCP is available for early preview  |  Blog  |  Chrome for Developers

WebMCP aims to provide a standard way for exposing structured tools, ensuring AI agents can perform actions on your site with increased speed, reliability, and precision.

Chrome for Developers

[Chrome DevTools Quick Tip 🔥]

Did you know that, apart from the currently selected element ($0), you can easily target the history of selected elements from the Element Panel in the Console? 🚀

#devtools #chromedevtools

🚀 Mở mã nguồn engine trình duyệt‑as‑a‑service chạy headful browsers trong Docker. Cho phép chạy đồng thời nhiều trình duyệt, kết nối CDP (Puppeteer, Playwright), lưu dữ liệu session (S3), hỗ trợ proxy, hàng đợi khởi động, không cần DevOps. Giấy phép Apache 2.0. #OpenSource #Docker #BrowserAutomation #Headful #ChromeDevTools #Puppeteer #Playwright #CôngNghệ #VietNam

https://www.reddit.com/r/SaaS/comments/1qha2qu/headful_browsers_in_docker_open_source/

Chrome 143 brings a big upgrade for AI‑assisted debugging: the Chrome DevTools MCP server.

AI agents can now:
- Attach to a live Chrome instance
- Inspect DOM, CSS, and accessibility tree
- Follow network requests and console messages, including DevTools Issues
- Capture performance traces and reload pages while ignoring cache when needed.

This is real runtime context for AI, not just static code analysis.

#ChromeDevTools #MCP #AI #webdev #frontend #JavaScript