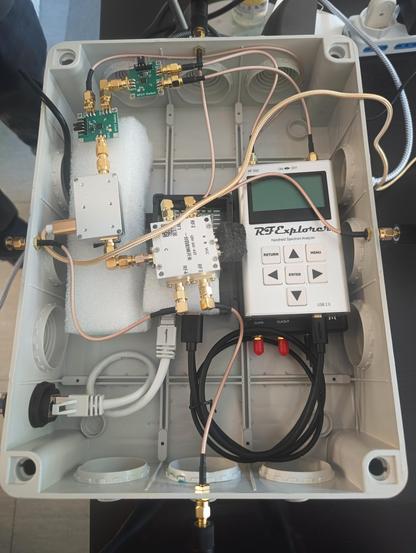
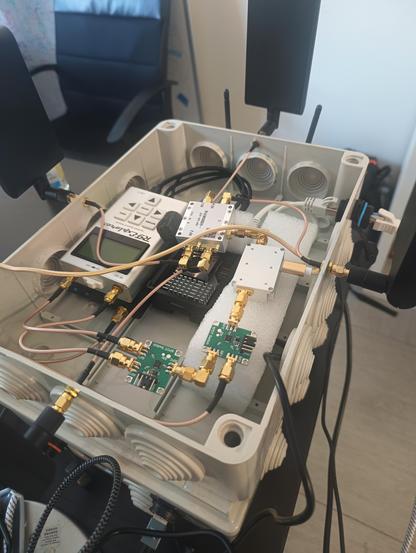
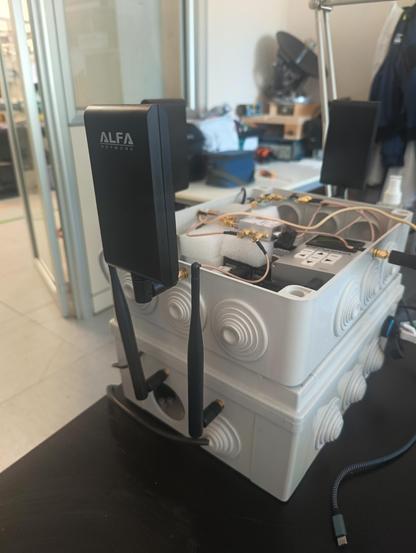
Sto preparando la candidatura per Maker Faire Rome di un progetto nato anche grazie al lavoro fatto su Drone Sky Check.
L’obiettivo è creare un nodo portatile di “air awareness” capace di ricevere:
ADS-B
Remote ID
OGN/FLARM
segnali RF legati ai droni
integrando tutto in una visualizzazione live 2D/3D.
Tantissime ore tra SDR, mappe, parsing, realtime e debug 😅 insieme agli amici di Drone Pilots Team
#DroneSkyCheck #SDR #RemoteID #CesiumJS #OpenData #MakerFaireRome
#DronePilotsTeam


 Qiita - 人気の記事
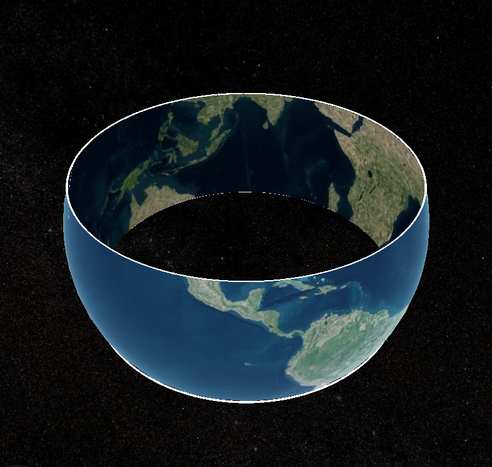


 3.34
3.34