Dynamics of Input indicator
Not advice. Just a fact.
Dynamics of Input indicator in the US stock market (USSM), as of 5/15/2026
The US stock market Input indicator is associated with the 3S Index.

Dynamics of Input indicator
Not advice. Just a fact.
Dynamics of Input indicator in the US stock market (USSM), as of 5/15/2026
The US stock market Input indicator is associated with the 3S Index.
Dynamics of Activity indicator
Not advice. Just a fact.
Dynamics of Activity indicator in the US stock market (USSM), as of 5/15/2026
The US stock market Activity indicator is associated with the 3S Index.

Dynamics of 3S Index
Not advice. Just a fact.
The current situation of the US stock market (USSM).
The 3S Index iS (USSM '5/15/2026' Large cap stock set), as of 5/15/2026
What is the USSM:
The USSM is an etalon stock set of the US Stock Market created by New Project.
The Components of the USSM:
https://docs.google.com/spreadsheets/d/1LJ2RNc-mahxzMmCCxRLy15YvzsWSjZ7ZQSuwW5jO9iA/edit?gid=694572901#gid=694572901


There are voices that the US Stock Market is in its most overextended state in history.
It's possible, even certain.
But an interesting question arises:
And where did all this money come from in the US stock market, and right now?
The S&P 500 took off like a rocket into the sky.
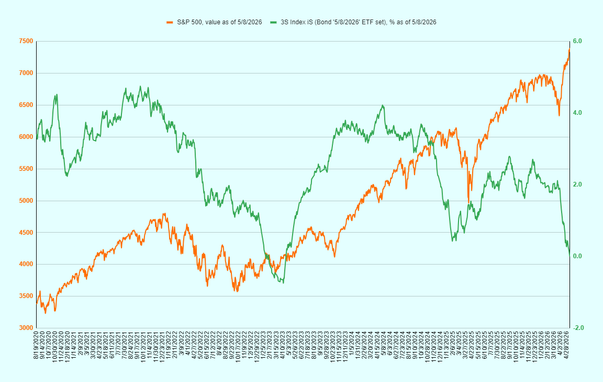
An Important Note regarding the cross-analysis S&P 500 vs 3S Index iS (Bond).
https://mastodon.social/@3Sindex/116555676047391730
It would be more accurate to construct this chart not only based on Bonds, but also to account for changes in the US dollar exchange rate—that is, to calculate the balance between the 3S Index (Bond) and 3S Index (Currency).
This won’t change anything fundamentally, but such a chart will be more accurate in the details.
Next time, that is will be done.
49 companies of the S&P 500 that have grown more than the index in all three intervals
To the Google Spreadsheets added a sheet named <49>:
https://docs.google.com/spreadsheets/d/1nIElPPQqkmxX-VPP_LTPVOmiA2MZrqjJBb5Pz_sHKuI/edit?usp=sharing
These companies can be described as "rising steadily" on the S&P 500 index.
List analysis at your discretion.
#Stocks #StockMarket #Investing #StockInvesting #USStockMarket #USStocks #3Sindex

CROSS-ANALYSIS
S&P 500 vs 3S Index iS (Bond).
Not advice. Just a fact.
Еhe bonds (especially US Treasuries) keep a cool head and are ultimately a better indicator of things. This is a strictly personal view.
For informational purposes, refer to the synthetic graph of the S&P 500 and 3S Index iS (Bond).
Bond ETF set (Components) of 3S Index can be viewed in the spreadsheets:
#Stocks #StockMarket #Investing #StockInvesting #USStockMarket #USStocks #3Sindex
Looking at today's US stock market I think that there really is a Great Mind in the Universe, because it doesn’t contact with us!
#Stocks #StockMarket #Investing #StockInvesting #USStockMarket #USStocks #3Sindex

So, the S&P 500 is growing.
At the expense of what?
https://mastodon.social/@3Sindex/116520292630146359
#Stocks #StockMarket #Investing #StockInvesting #USStockMarket #USStocks #3Sindex